
Special Articles on the Potential of LLM Technologies to Support Business
Technical Initiatives Supporting LLM Value-added Platform
Natural Language Processing Generative AI DX
Yutaro Shiramizu, Shusuke Tatsumi, Issei Nakamura, Kengo Taketani, Chijia Huang and Xinyu Guo
Service Innovation Department
Abstract
Since the appearance of ChatGPT, LLMs have been attracting attention throughout the world and their use in business has been accelerating. NTT DOCOMO has developed an “LLM value-added platform” for using LLMs safely and conveniently and is now providing it within the NTT DOCOMO Group. This article provides an overview of the LLM value-added platform and describes RAG accuracy improvements, UI/UX enhancements, and dashboard development as initiatives toward improving the performance and analyzing the use of the LLM value-added platform.
01. Introduction
-
Generative Artificial Intelligence (AI)*1 is attracting ...
Open

Generative Artificial Intelligence (AI)*1 is attracting attention on a global basis. In particular, Large Language Model (LLM)*2 technology that can generate text and engage in natural conversations like a human is being rapidly introduced in many companies given its high level of performance and its applicability to a wide range of industries and fields. As part of this trend, NTT DOCOMO has developed an “LLM value-added platform” for using LLMs with the aim of making work more efficient and creating new business. This platform is now being provided within the NTT DOCOMO Group [1][2].
To use an LLM effectively within a company and to expand usage scenarios, it is not sufficient to simply provide the LLM. It is also essential to continuously improve an LLM platform as well as platform peripheral functions and platform operation processes. This includes the development of applications and tools for using the LLM tailored to on-site needs, the design and provision of an easy-to-use User Interface (UI)*3 to promote LLM use, and the uncovering and horizontal expansion of in-house use cases.
One LLM-related technology that is particularly applicable to business needs is Retrieval-Augmented Generation (RAG), and at NTT DOCOMO, we are addressing RAG from the two viewpoints of improving the accuracy of retrieval and making in-house operations more efficient. Specifically, RAG is a technology for increasing the accuracy of retrievals and responses by using text generation by LLMs in an information retrieval system. There are great expectations that RAG will contribute to enhancing operations at contact centers and making back-office work more efficient. For users, the LLM value-added platform provides RAG supporting the retrieval of internal company documents as an “online document search” to enable the retrieval of accurate and useful information.
One initiative for making the LLM value-added platform more convenient to use is to develop an original UI based on the knowledge gained from conducting on-site interviews and observing behavior. Our goal here is to retain users and make business processes all the more efficient by designing user-friendly screens used on the LLM value-added platform in accordance with use cases.
Furthermore, with the aim of accumulating know-how and organizational knowledge, creating new methods of using LLMs, determining usage in each organization, and expanding the use of the LLM value-added platform through internal sharing of the above, we have built a user-usage log collection pipeline*4 and visualization system (dashboard*5) for the LLM value-added platform and have released them to internal users.
This article describes technical initiatives for supporting the LLM value-added platform promoted by NTT DOCOMO from the viewpoints of RAG, UI and User Experience (UX)*6, and dashboard design.
- Generative AI: AI technology that can automatically generate new content such as text, images, music and code.
- LLM: A large-scale artificial intelligence model trained by machine learning using a large volume of text data. In this article, it refers in particular to a model that can understand context and generate natural, human-like text.
- UI: The elements of a screen operated by the user such as design, buttons, icons and input fields.
- Pipeline: A mechanism that performs sequential processing of data according to a series of procedures.
- Dashboard: An interface that visually presents certain indices, data, etc. in such a way that they can be grasped at a glance using graphs and statistical data.
- UX: Experiences such as ease of use, degree of satisfaction, and impressions felt by a user when using a service.
-
2.1 Initiatives for Improving Retrieval Accuracy
Open
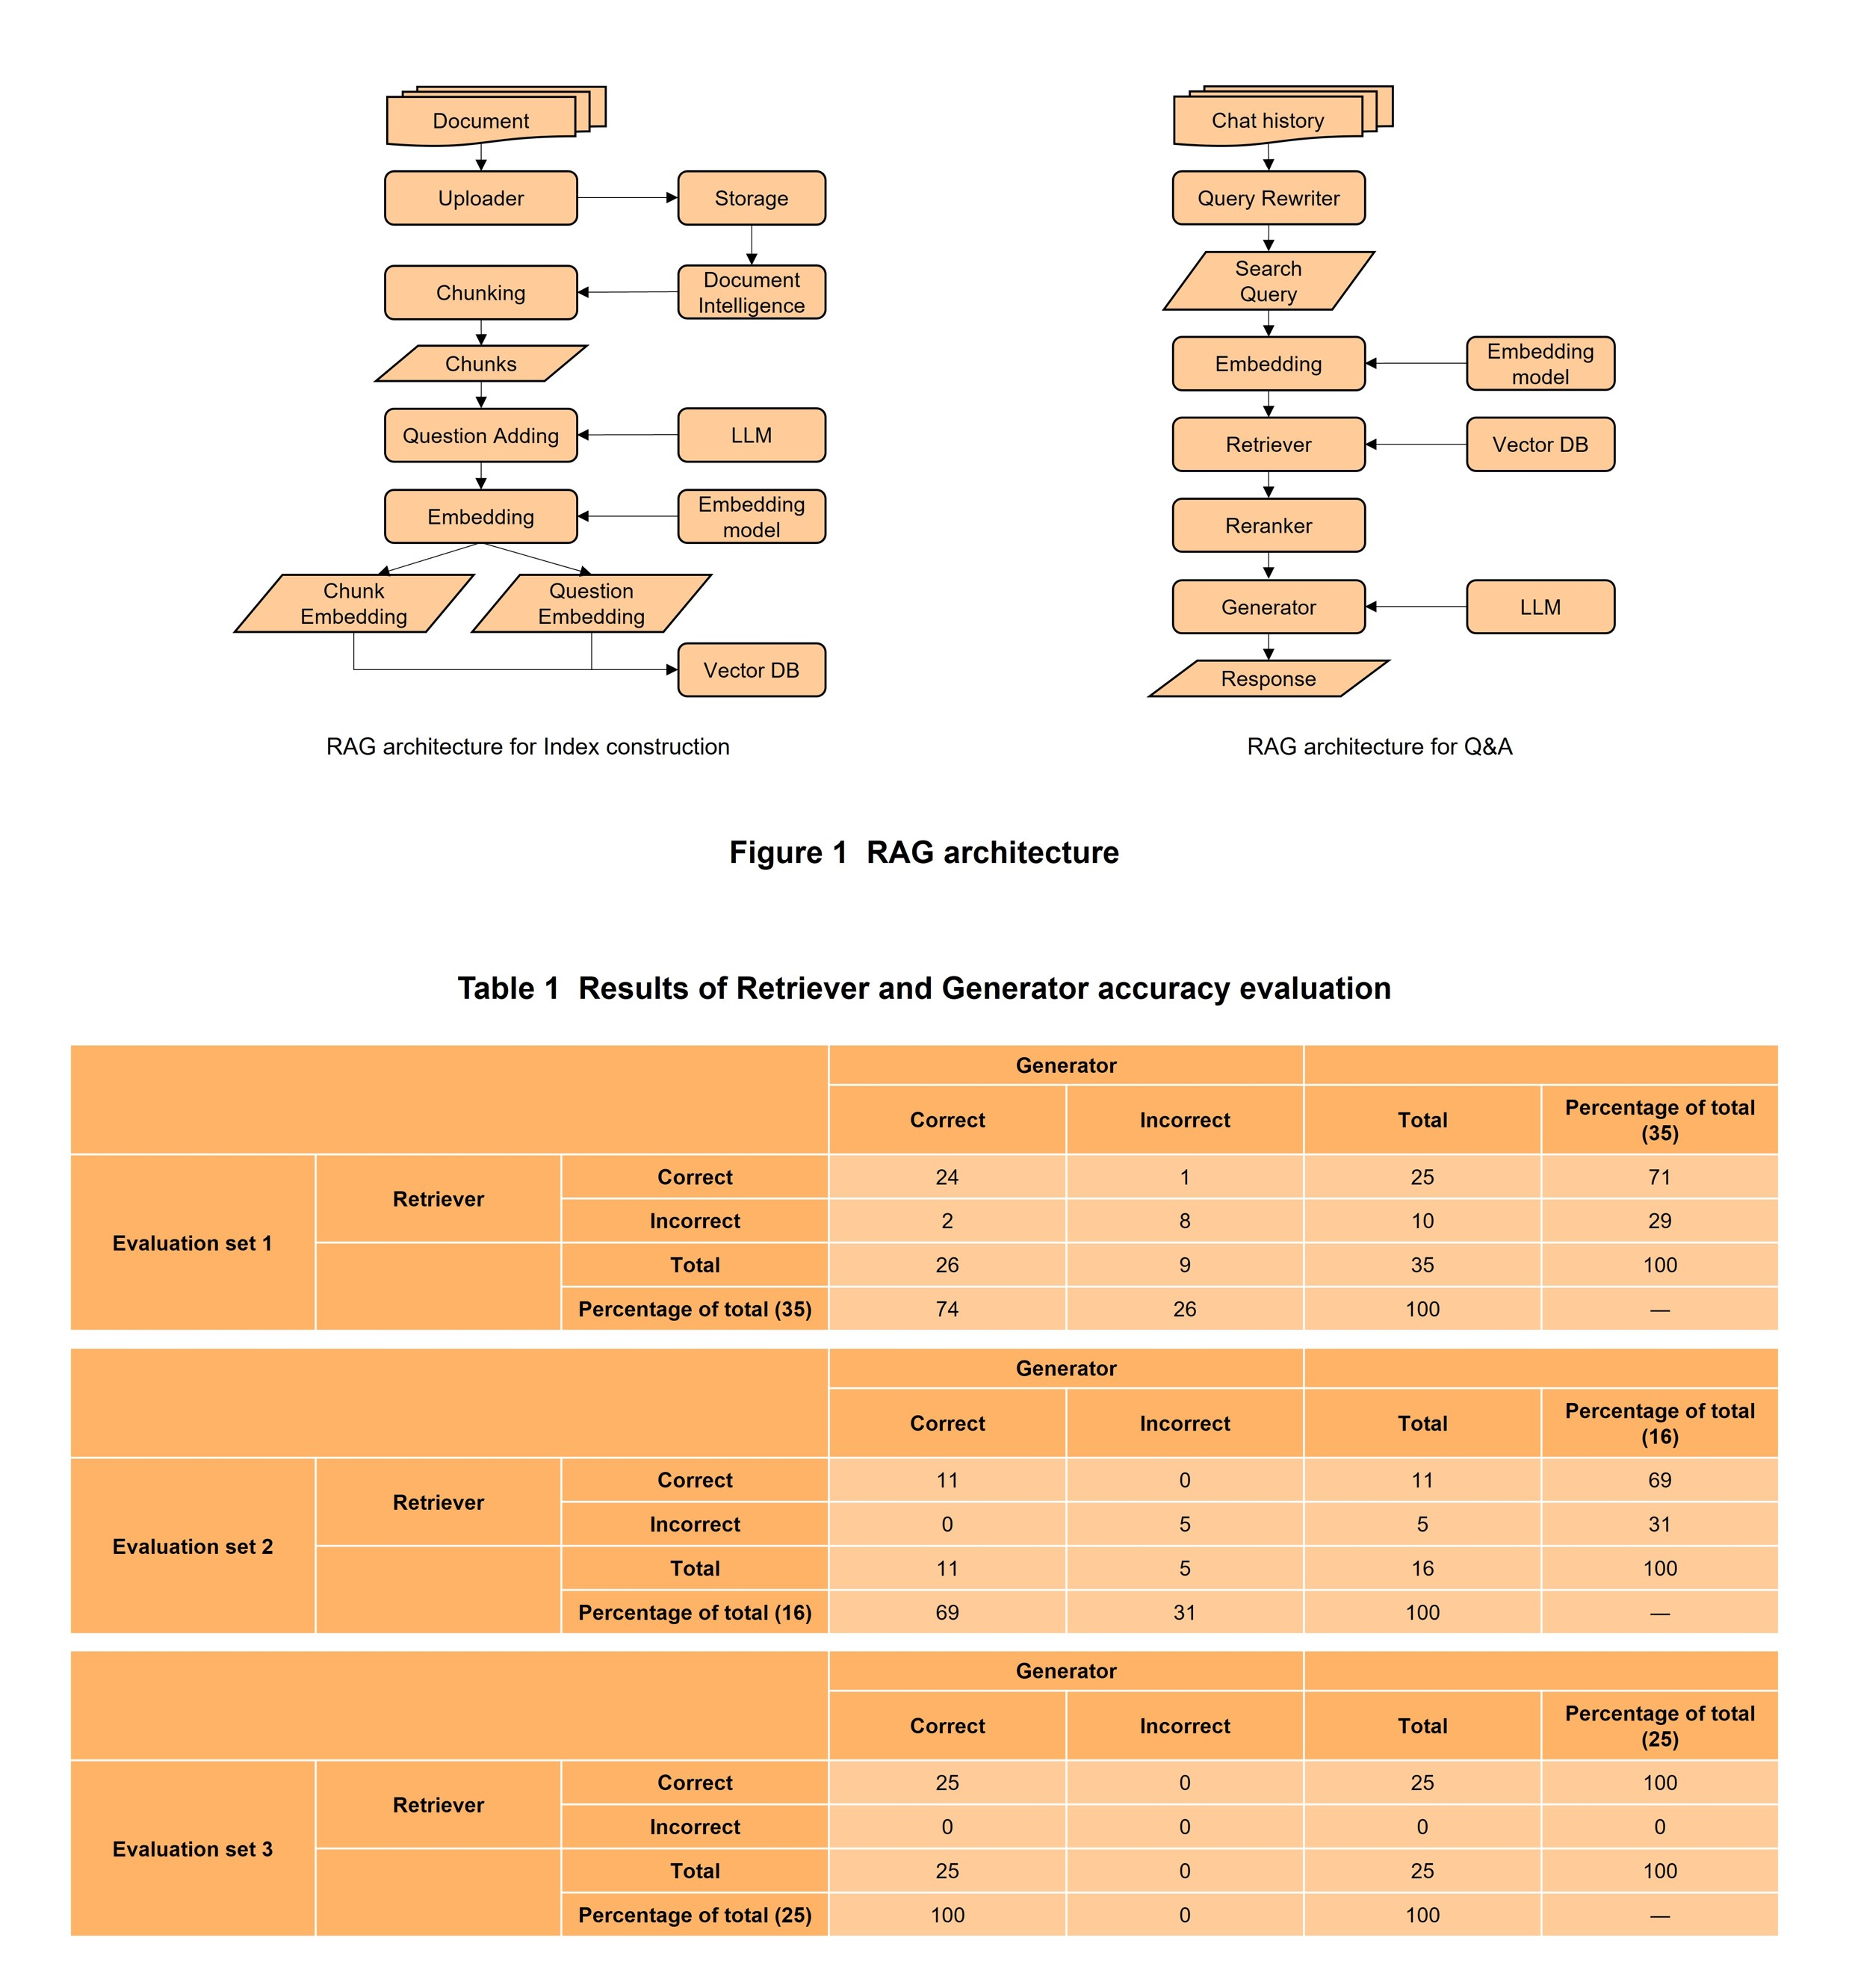
1) RAG Architecture*7
The RAG architecture of the LLM value-added platform is divided into architecture for constructing an Index as a data store that can efficiently retrieve documents and architecture for Q&A (Figure 1).
The architecture for Index construction consists of three functions: an Uploader function for uploading target documents, a Question Adding function for improving the accuracy of Retriever (described below) by generating expected questions from those documents and storing them in Index linked to the documents, and a Chunk/Question Embedding function for turning chunks*8 and added questions into vectors and storing them in a vector DB*9 for vector searching.
The architecture for Q&A consists of four functions: a Query Rewriter function for extending a query*10 to improve retrieval accuracy, a Retriever function for retrieving documents to be referenced when generating answers, a Reranker function for adjusting the output results of Retriever, and a Generator function for generating answers to be presented to the questioner.
2) Accuracy Evaluation
(a) Overview
Since retrieving internal documents and answering user questions is one business use envisioned for RAG, accuracy is an important issue here. We therefore performed an accuracy evaluation of the elemental technologies involved in Q&A as one means of improving RAG accuracy.
The RAG technique can be broadly divided into two elemental technologies: Retriever for retrieving related documents and Generator for receiving Retriever results and generating answers. These technologies are implemented as serial processing, so that if the preceding results of Retriever are incorrect, the succeeding results of Generator will likewise be incorrect, logically speaking. With this being the case, we evaluated the results of Generator, the final output, and the results of Retriever as intermediate processing that can cause a drop in accuracy. We performed the evaluation in a two-tier manner as “mostly correct” and “clearly incorrect” and summarized the results in a matrix.
(b) Evaluation dataset
With a view to evaluating performance, we created three types of evaluation datasets based on internal operation manuals. Evaluation datasets 1 and 2 each consisted of multiple PDF documents with about 100 pages per document. Evaluation dataset 3, meanwhile, consisted of a dozen of Microsoft Word, Microsoft PowerPoint, and Microsoft Excel documents. Each of these evaluation datasets consisted of reference documents and Q&A for evaluation use, and we carried out the work of evaluating the accuracy of RAG in terms of Q&A for evaluation use by registering the reference documents in the RAG Index.
(c) Evaluation results
(1) Results of Retriever and Generator accuracy evaluation
Results of evaluating the accuracy of Retriever and Generator are listed in Table 1. As shown, Retriever retrieval accuracy was 71% for evaluation dataset 1, 69% for evaluation dataset 2, and 100% for evaluation dataset 3, and Generator generation accuracy was 74% for evaluation dataset 1, 69% for evaluation dataset 2, and 100% for evaluation dataset 3. Additionally, for all evaluation datasets, there was only one case in which Retriever was correct but Generator was incorrect. This result tells us that if Retriever is correct, Generator will usually generate a correct answer, which indicates that any RAG bottlenecks lie in Retriever. At NTT DOCOMO, we have concentrated our efforts in improving the accuracy of Retriever based on the above findings.
At the same time, there were two cases in evaluation dataset 1 in which Generator was correct despite the fact that Retriever was incorrect. This phenomenon is thought to occur when Generator generates an answer based not on Retriever output but on LLM prior knowledge. To check whether this hypothesis is valid, we evaluated the answer-generation accuracy of Generator alone using the same evaluation dataset. In this case, the correct-answer rate was 57% for evaluation dataset 1, 6% for evaluation dataset 2, and 42% for evaluation dataset 3, which means that Generator on its own could correctly perform Q&A about half of the time for evaluation datasets 1 and 3. In fact, evaluation datasets 1 and 3 also included general knowledge and information released on the Internet, which is consistent with experimental results.
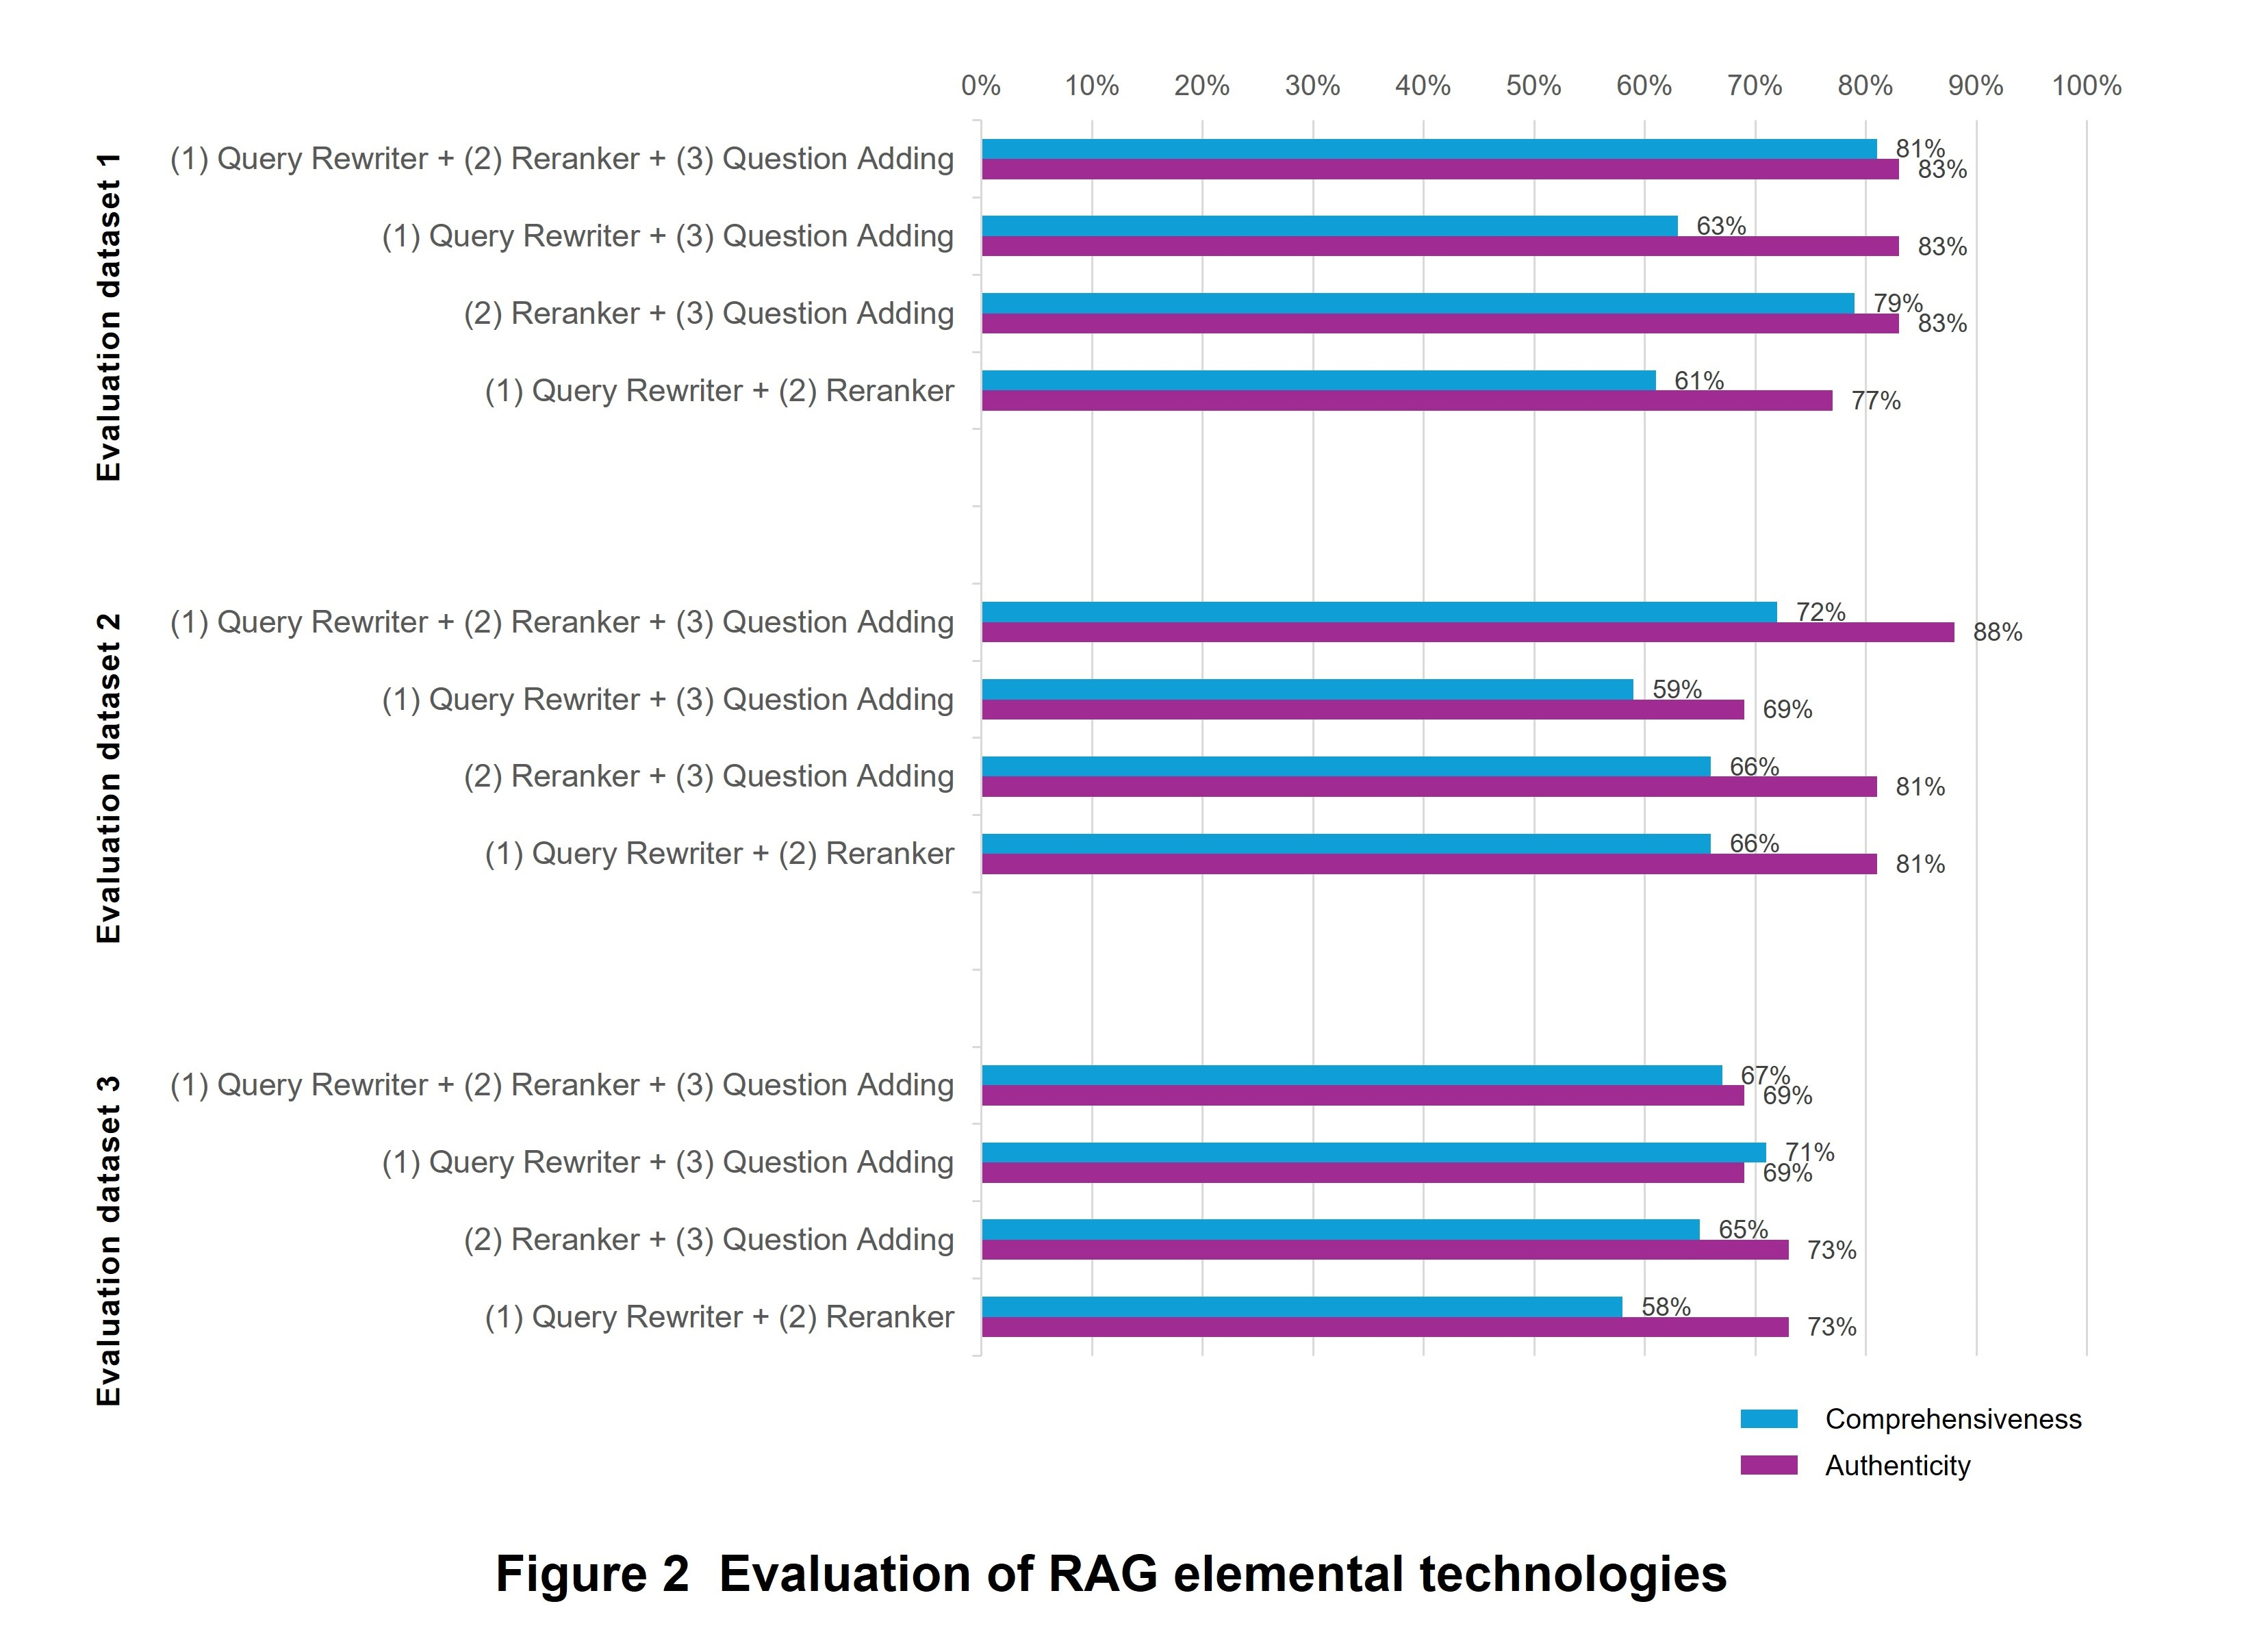
(2) Evaluation by Query Rewriter, Reranker, and Question Adding elemental technologies
Next, we evaluated the extent to which the Query Rewriter function, Reranker function, and Question Adding function, which are implemented to improve the accuracy of Retriever, actually contribute to improving accuracy. Specifically, we evaluated accuracy for a total of four cases—one case including all three functions and each of the other cases in which one of the functions is missing—in terms of comprehensiveness (percentage of answers in which all necessary information is covered) and authenticity (percentage of answers with no hallucination*11) and compared the results (Figure 2).
Differences in the effects of each elemental technology could be seen depending on the evaluation dataset. In particular, accuracy was highest for the case including all three functions for evaluation datasets 1 and 2, so it could be seen that each of these technologies helped to improve accuracy. For evaluation dataset 3, however, accuracy dropped overall. These results suggest that there are elemental technologies that are either highly or hardly suitable for each document format. Going forward, we plan to analyze which document formats each elemental technology is good at and to study architecture design that enables elemental technologies to be flexibly combined and used according to the type of document format.
2.2 Improving Convenience in Internal Operations
1) Development of a Suitability Check Sheet
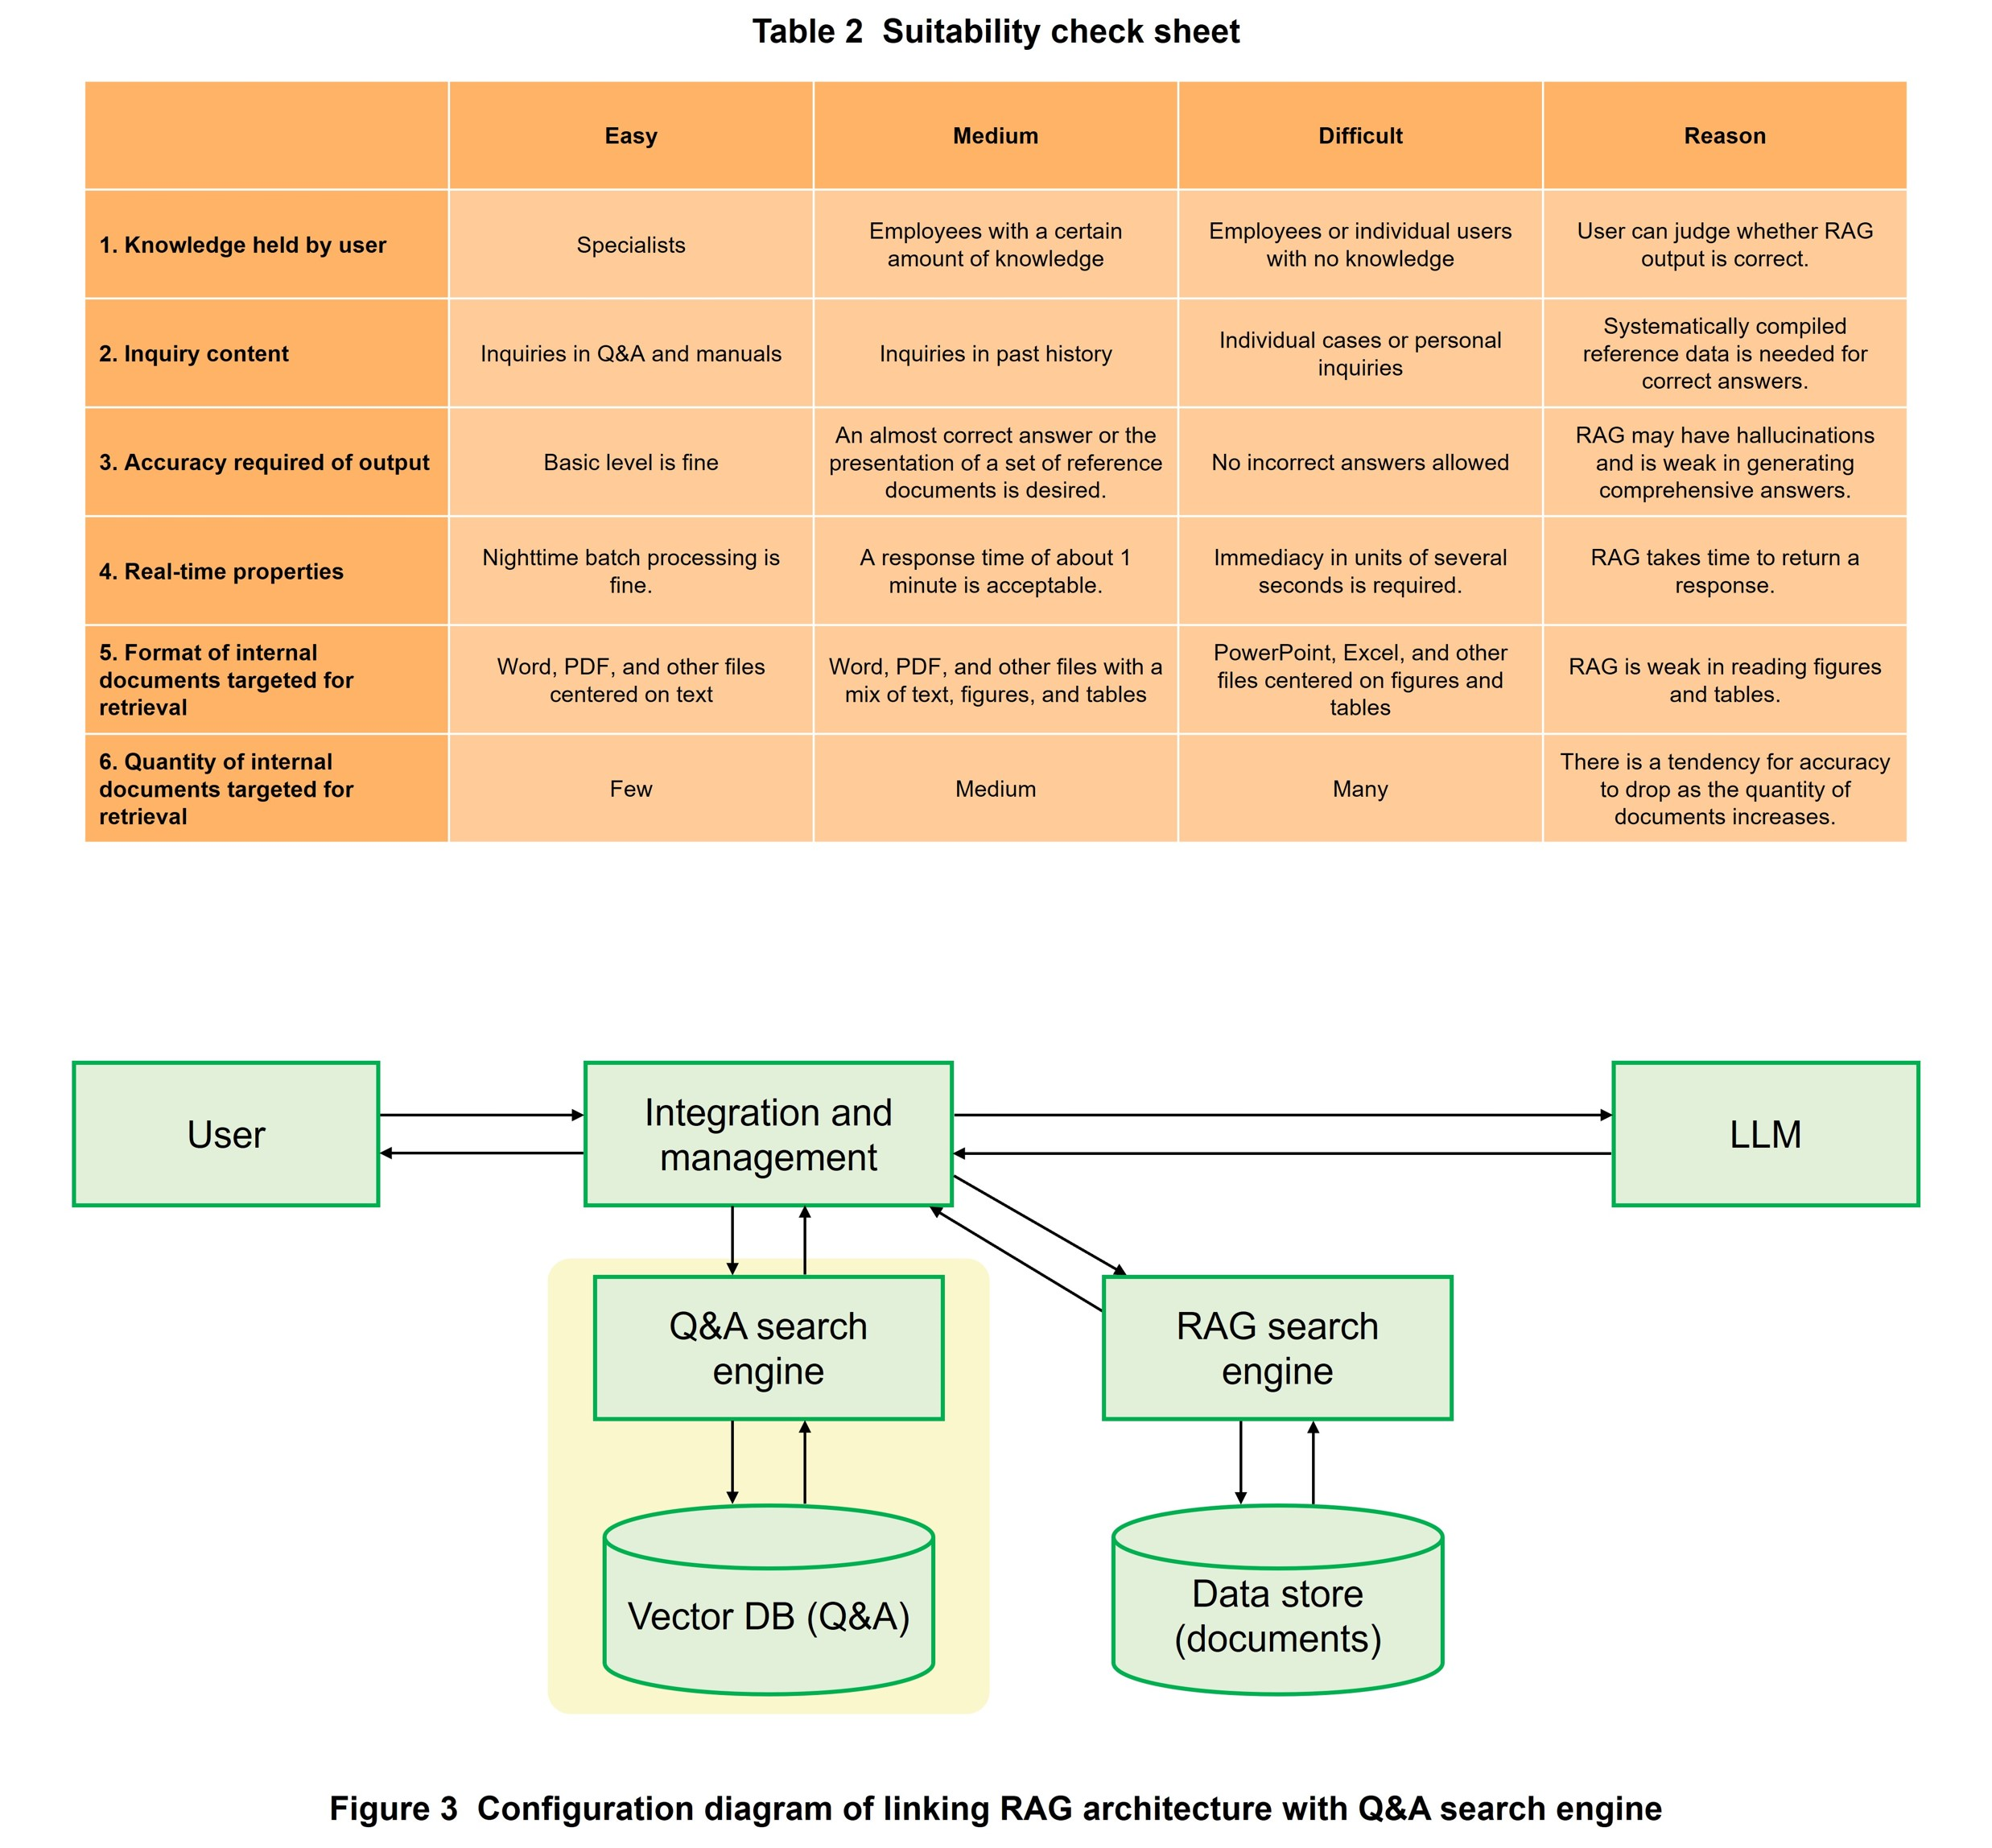
As a useful technology using LLMs, RAG is generating great expectations in particular among managers close to on-site work. However, there are not a few examples of actual business sites where it is difficult to apply RAG due to the difficulty of gathering up documents or the difficulty of improving the accuracy of answers. We have therefore prepared an original “suitability check sheet” for internal distribution so that organizations considering the introduction of RAG can autonomously decide whether to introduce RAG and select which work to target for introduction.
As shown in Table 2, this suitability check sheet consists of a suitability matrix having six check items and three degrees of introduction difficulty in the form of easy, medium, and difficult. The user applies envisioned use cases to applicable cells to determine the suitability of RAG to that work.
2) Linking with Q&A Search Engine
If sufficient Q&A data can be prepared for basic information and questions that have been asked many times, referencing that Q&A data directly to get answers is often more accurate and less costly than retrieving documents and manuals by RAG. With this in mind, we have been collaborating with a department in possession of large quantities of Q&A data used for designing internal/external help desks and have been studying the linking of RAG architecture and a Q&A search engine to improve the accuracy of the retrieval system as a whole (Figure 3). At first, we tested the method of storing Q&A as a RAG reference document, but accuracy could not be sufficiently improved, so we introduced a vector DB storing Q&A and a Q&A search engine for searching that data in a method optimized for Q&A and studied operations linking them with RAG.
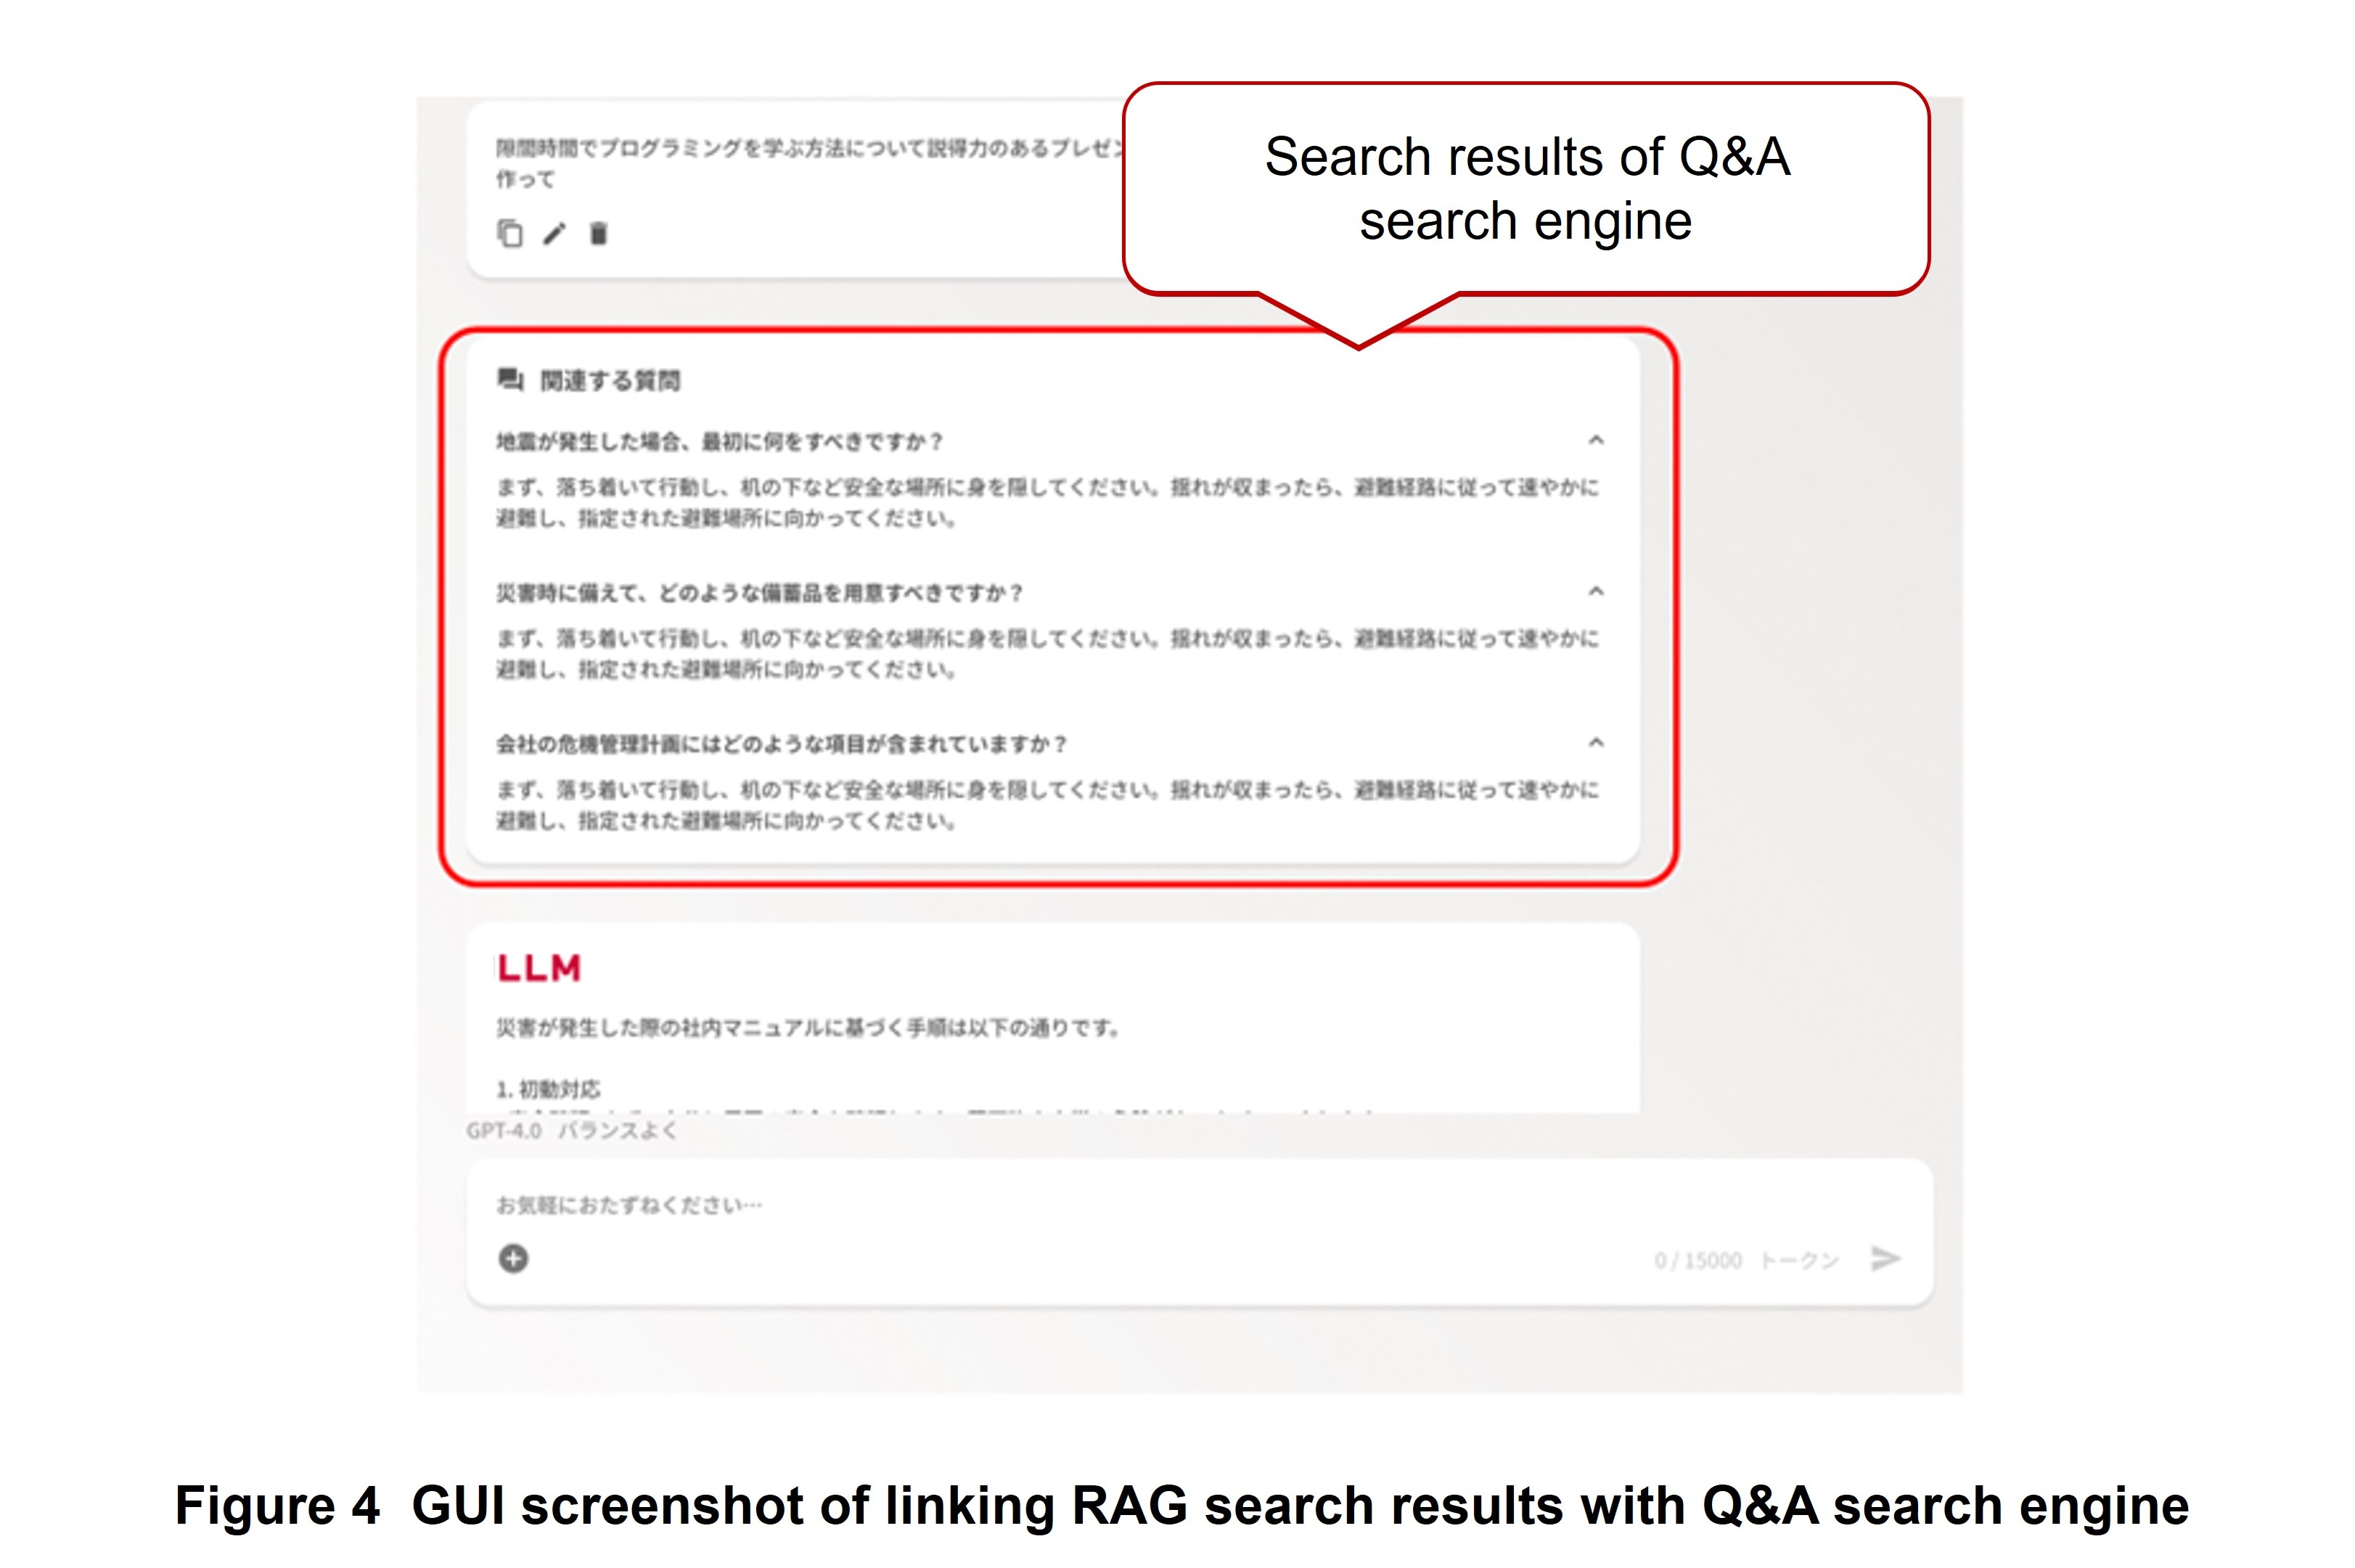
As part of this linking with the Q&A search engine, we also studied the creation of a Graphical User Interface (GUI)*12 that presents RAG search results simultaneously with Q&A search engine results. A screenshot of this GUI is shown in Figure 4. As in Web searching, we plan to present similar questions and associated answers generated as hits by the Q&A search engine as related items.
- Architecture: Descriptions and arrangements related to questions like what are the constituent elements of a system, what function and role are performed by each of those elements, and how do they interact with each other and function together as a single system.
- Chunks: The breaking up of text into small meaningful units or lumps such as noun phrases, verb phrases, and other clauses.
- Vector DB: A database used when handling text, images, sound, and other forms of data in vector form. It features high-speed and stable operation against large volumes of data in tasks like similarity search and anomaly detection.
- Query: A question or inquiry input by the user into a search engine or database.
- Hallucination: The phenomenon in which AI generates information contrary to facts or information on something does not actually exist.
- GUI: An interface that is operated using visual elements such as icons and buttons.
-
3.1 Customer Journey Analysis
Open
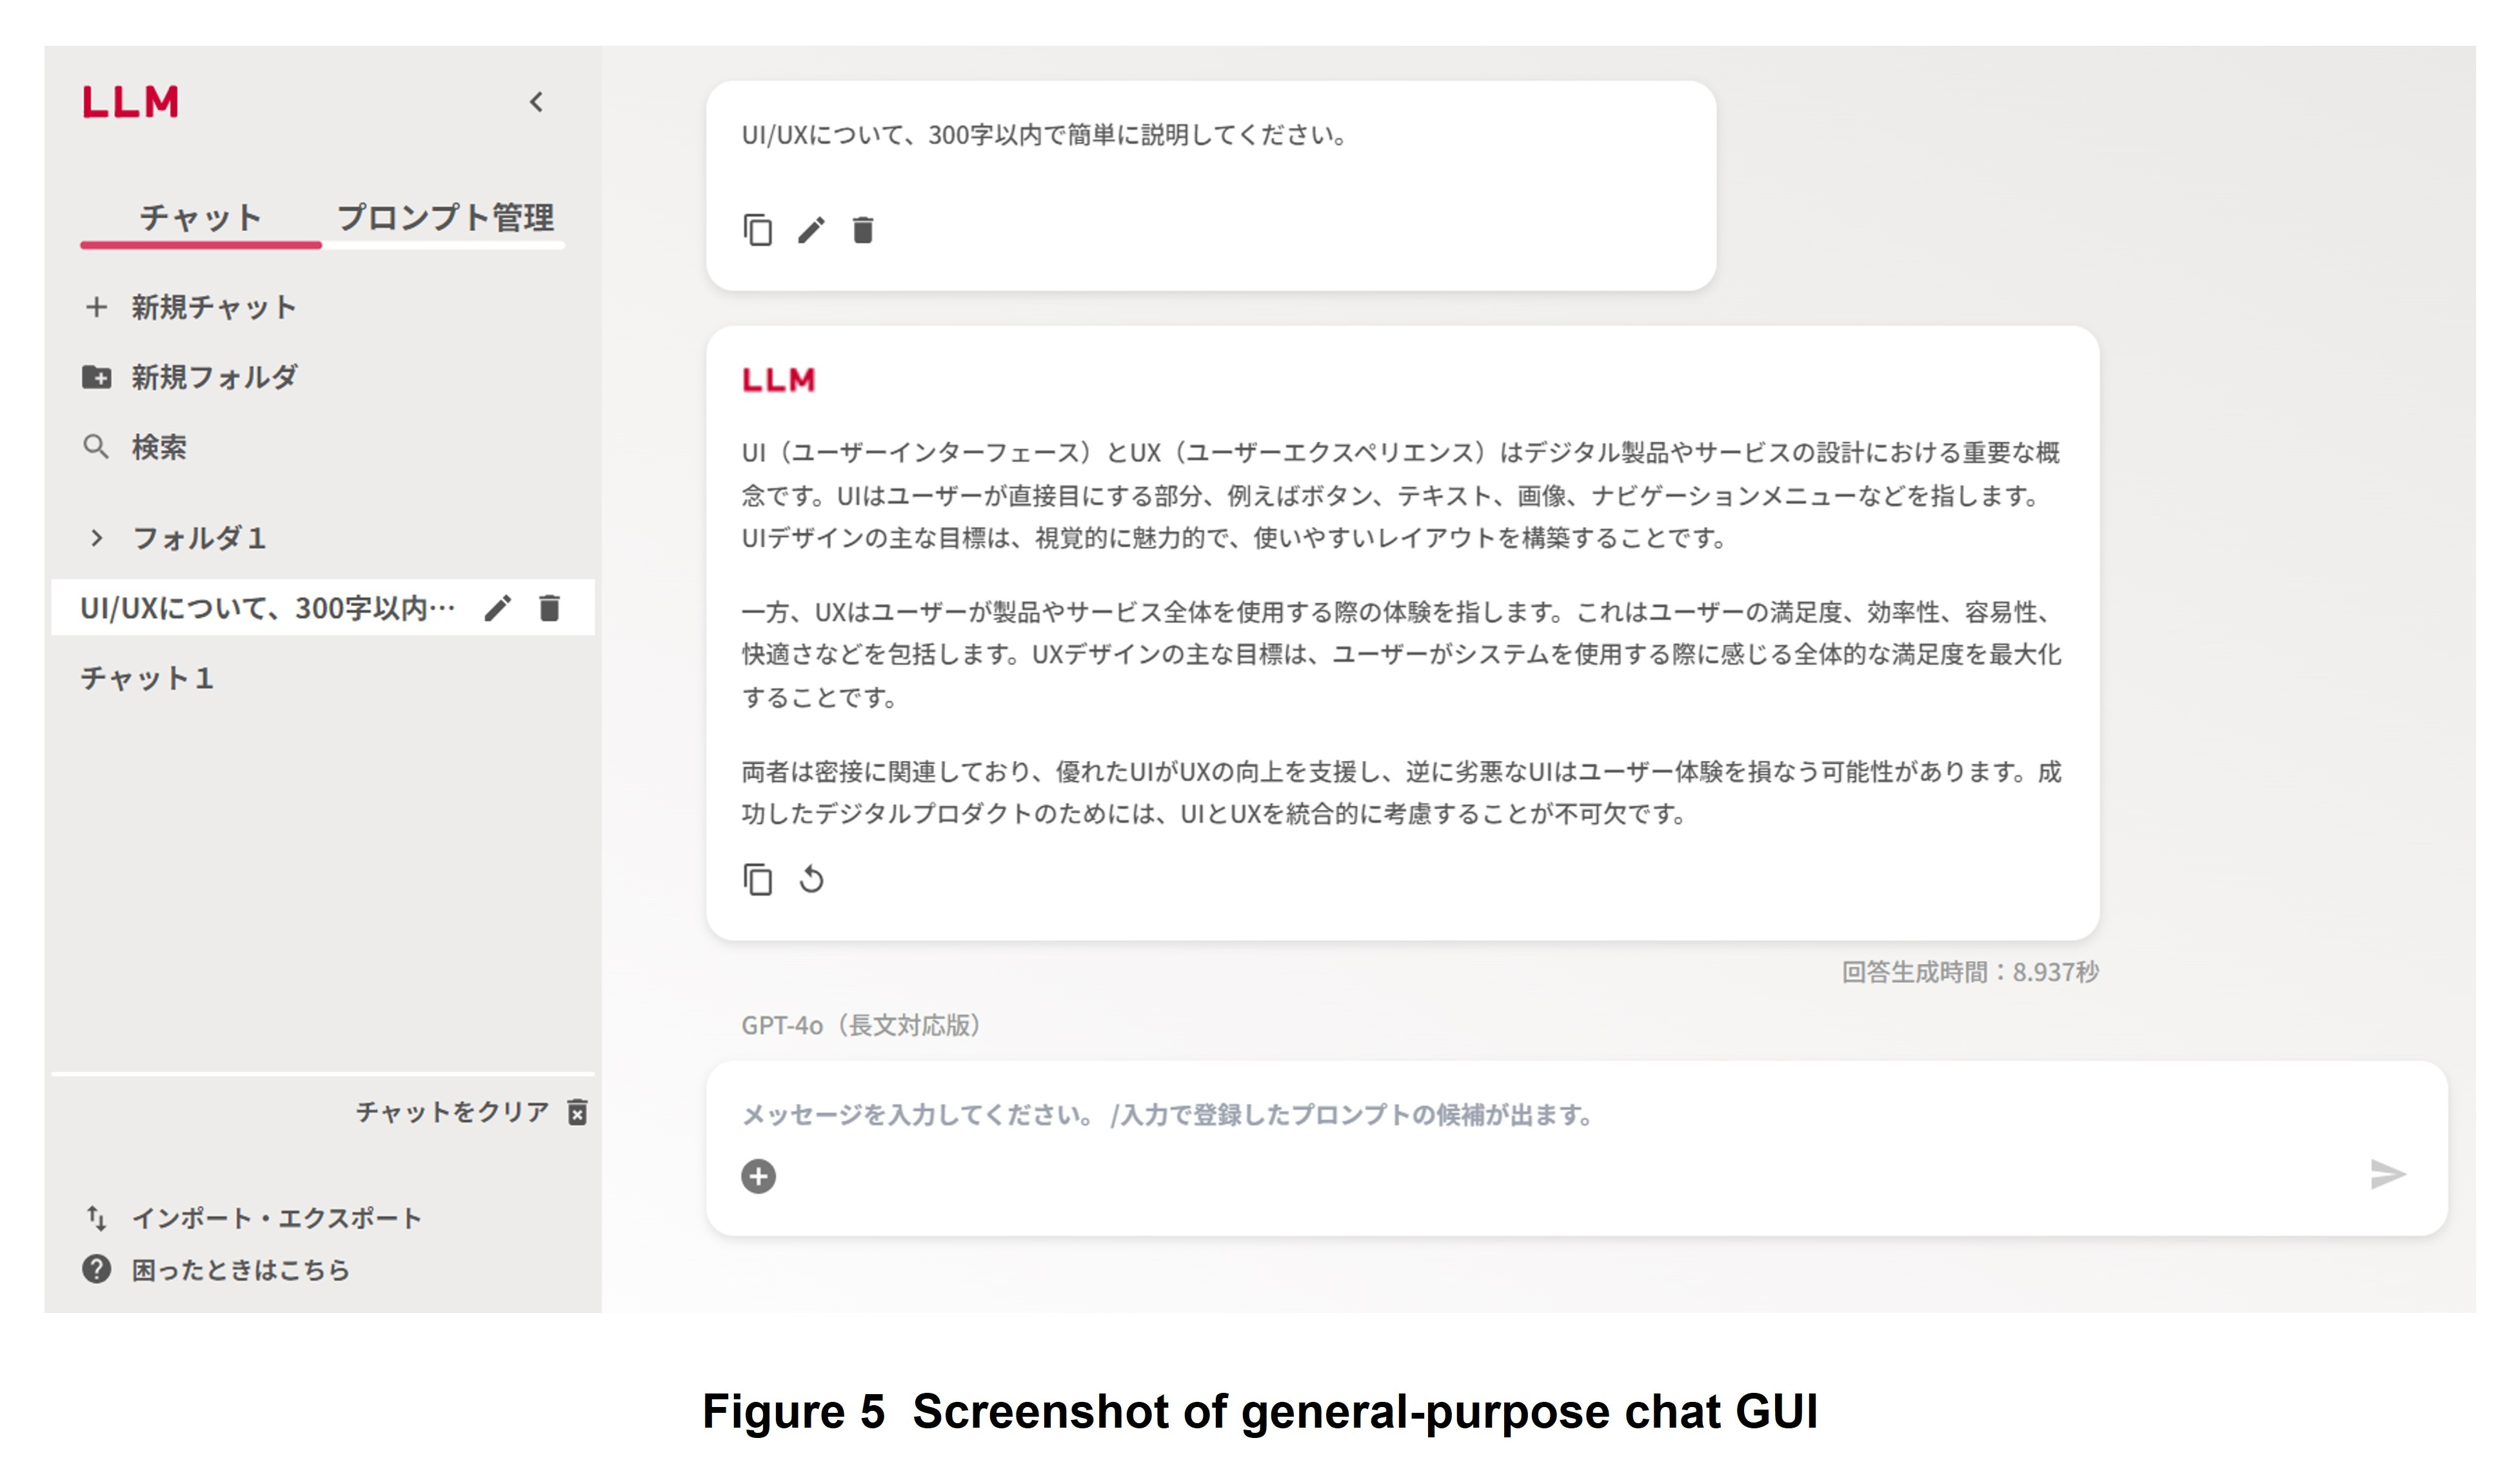
At NTT DOCOMO, we designed an original GUI that envisioned diverse usage scenarios within the company and are providing it as part of our efforts in improving UI/UX to retain users of the LLM value-added platform, make work more efficient, and boost convenience (Figure 5).
This time, in addition to providing a general-purpose GUI, we performed a customer journey analysis*13 toward the creation of new dedicated GUIs that match specific use cases. Here, as a specific use case, we selected “Q&A in relation to internal business processing using online document search” for which significant jumps in work efficiency by LLMs are expected. We then conducted the following survey while obtaining the cooperation of users (personnel who use an LLM to search for and create answers with respect to inquiries).
To begin with, we conducted a questionnaire-based survey targeting users to determine, for example, work content and frequency, things felt to be inconvenient when retrieving documents, processes for which an LLM can be relied upon and processes that cannot be left to an LLM. Next, we observed the work actually performed by users and determined what kind of activities are involved in what kind of work flow and which processes take time to complete. Finally, we conducted interviews with users to determine things that they felt dissatisfied with and would like to make more efficient and functions that they felt were needed in a GUI.
As a result of this survey, it became clear that work times and work processes differ according to the proficiency of users in the work of responding to inquiries and that significant improvements in efficiency could be expected especially for users with low proficiency if an LLM were to be used skillfully. Additionally, while it is well known that hallucinations that occur from time to time with an LLM is an issue in the use of LLMs in business scenarios, it was suggested that the prevention of misinformation caused by hallucinations is particularly valuable when using an LLM in the work of replying to inquiries.
On the basis of these results, we found that meeting user needs, making work more efficient, and retaining users require not a simple design of just supplying answers using an LLM but rather an advanced UI design.
3.2 GUI Design Based on Analysis
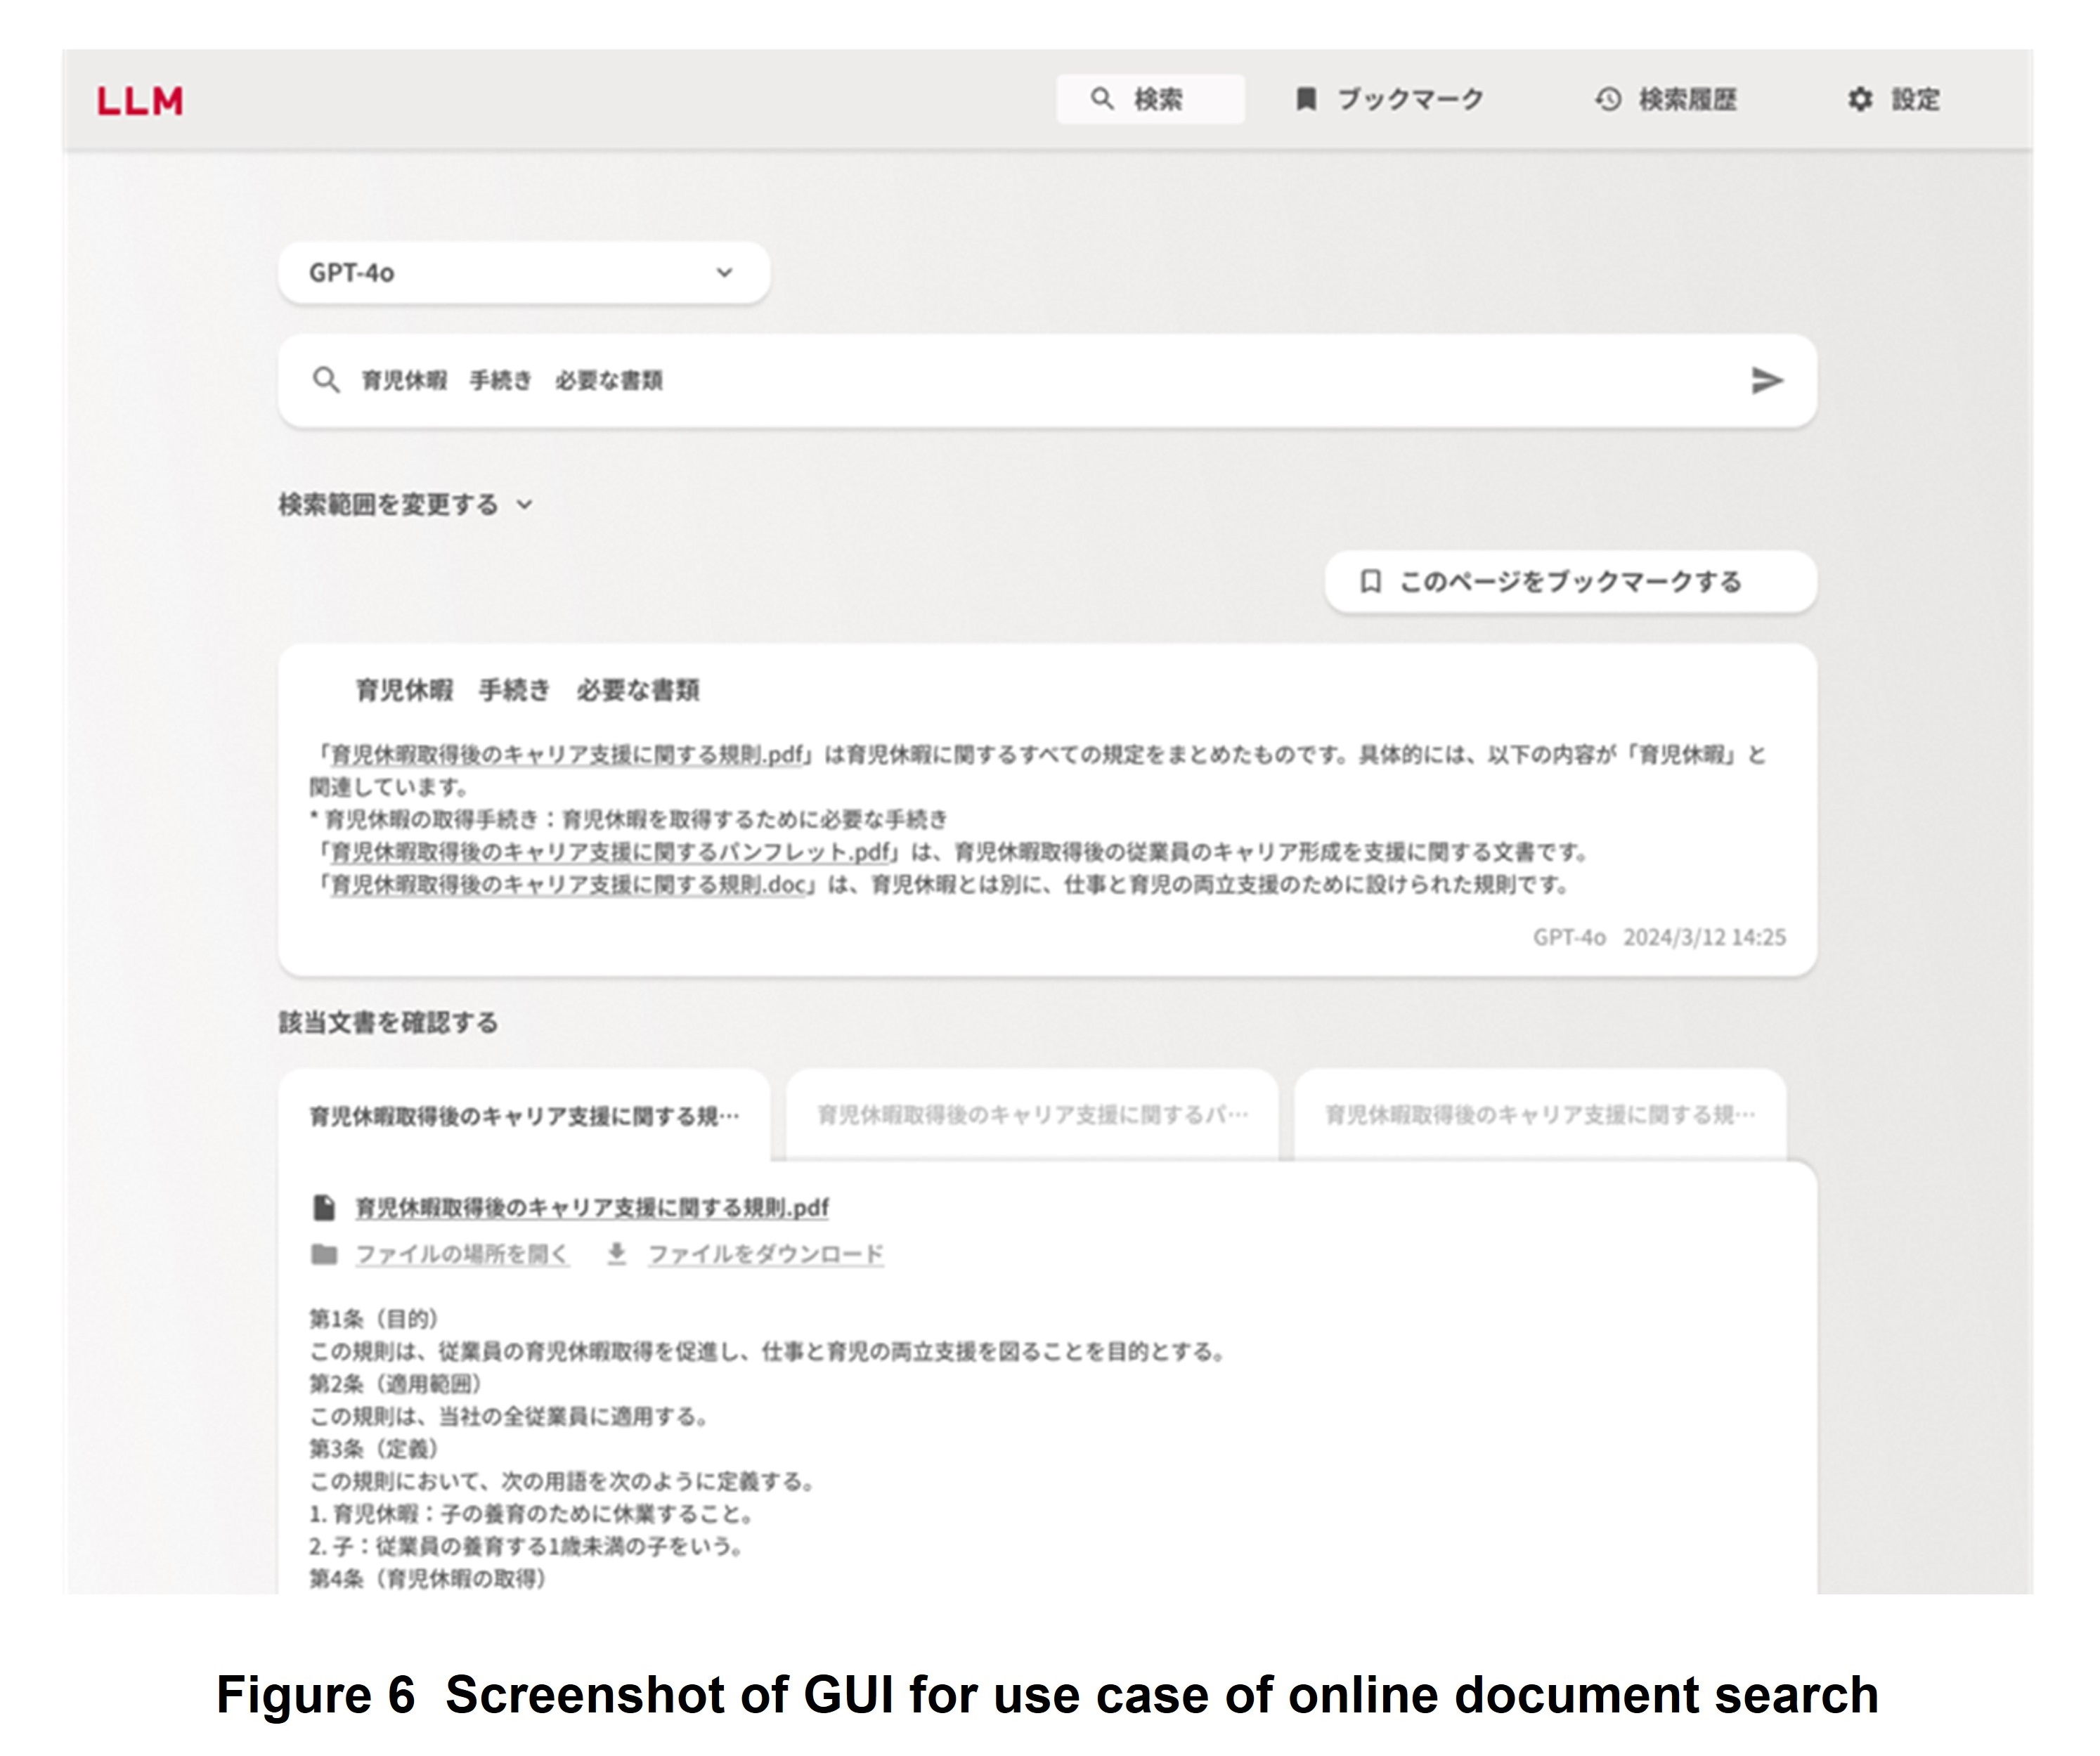
A GUI for the use case of online document search that we originally developed based on the knowledge gained from our customer journey analysis is shown in Figure 6. The user can perform a search through this dedicated GUI and then review LLM answers based on manuals or other documents or bring up the documents themselves appearing as hits.
This GUI for the use case of online document search is equipped with various features to enable the user to verify whether an LLM answer is correct. In addition to the answer generated by the LLM, the GUI can display the top three hits from the online document search, display all documents instead of only some, download a document appearing as a hit, or check the location of the original file. It also features bookmark and search-history functions to make it easy to compare search results with those of other search conditions.
In this way, by providing dedicated GUIs that envision specific use cases separate from a general-purpose GUI for using an ordinary LLM, we aim to retain more users and make work processes more efficient.
- Customer journey analysis: A technique for analyzing a series of processes from the time that a user learns about a product or service to actually using it with the aim of providing a better user experience or improving user satisfaction.
-
4.1 Background of Development
Open
Monitoring the usage of the LLM value-added platform is crucial for several reasons: it allows platform developers to continuously improve the service and audit the input content, enables those in charge of promoting LLM usage to measure the effectiveness of their initiatives, and facilitates the deployment of valuable use cases leveraging LLMs to users. Upon the initial release of the LLM value-added platform, we periodically prepared manual reports to provide statistical information such as the number of user requests per organization, as well as the major use cases of the LLM. However, as the log size grew explosively with increased use, manual analysis became inefficient. We therefore developed a dashboard that can automatically visualize such statistical information and examples of user usage analyzed by the LLM and released it to LLM value-added platform users.
4.2 Overview of Visualization
1) Dashboard Development
At the time of the writing of this article, the LLM value-added platform dashboard consisted of four pages: “overall statistical information,” “weekly ranking of usage trends,” “weekly list of usage examples,” and “weekly user prompt*14 details.” The dashboard has been developed using Databricks [3] and Power BI [4] provided by Microsoft.
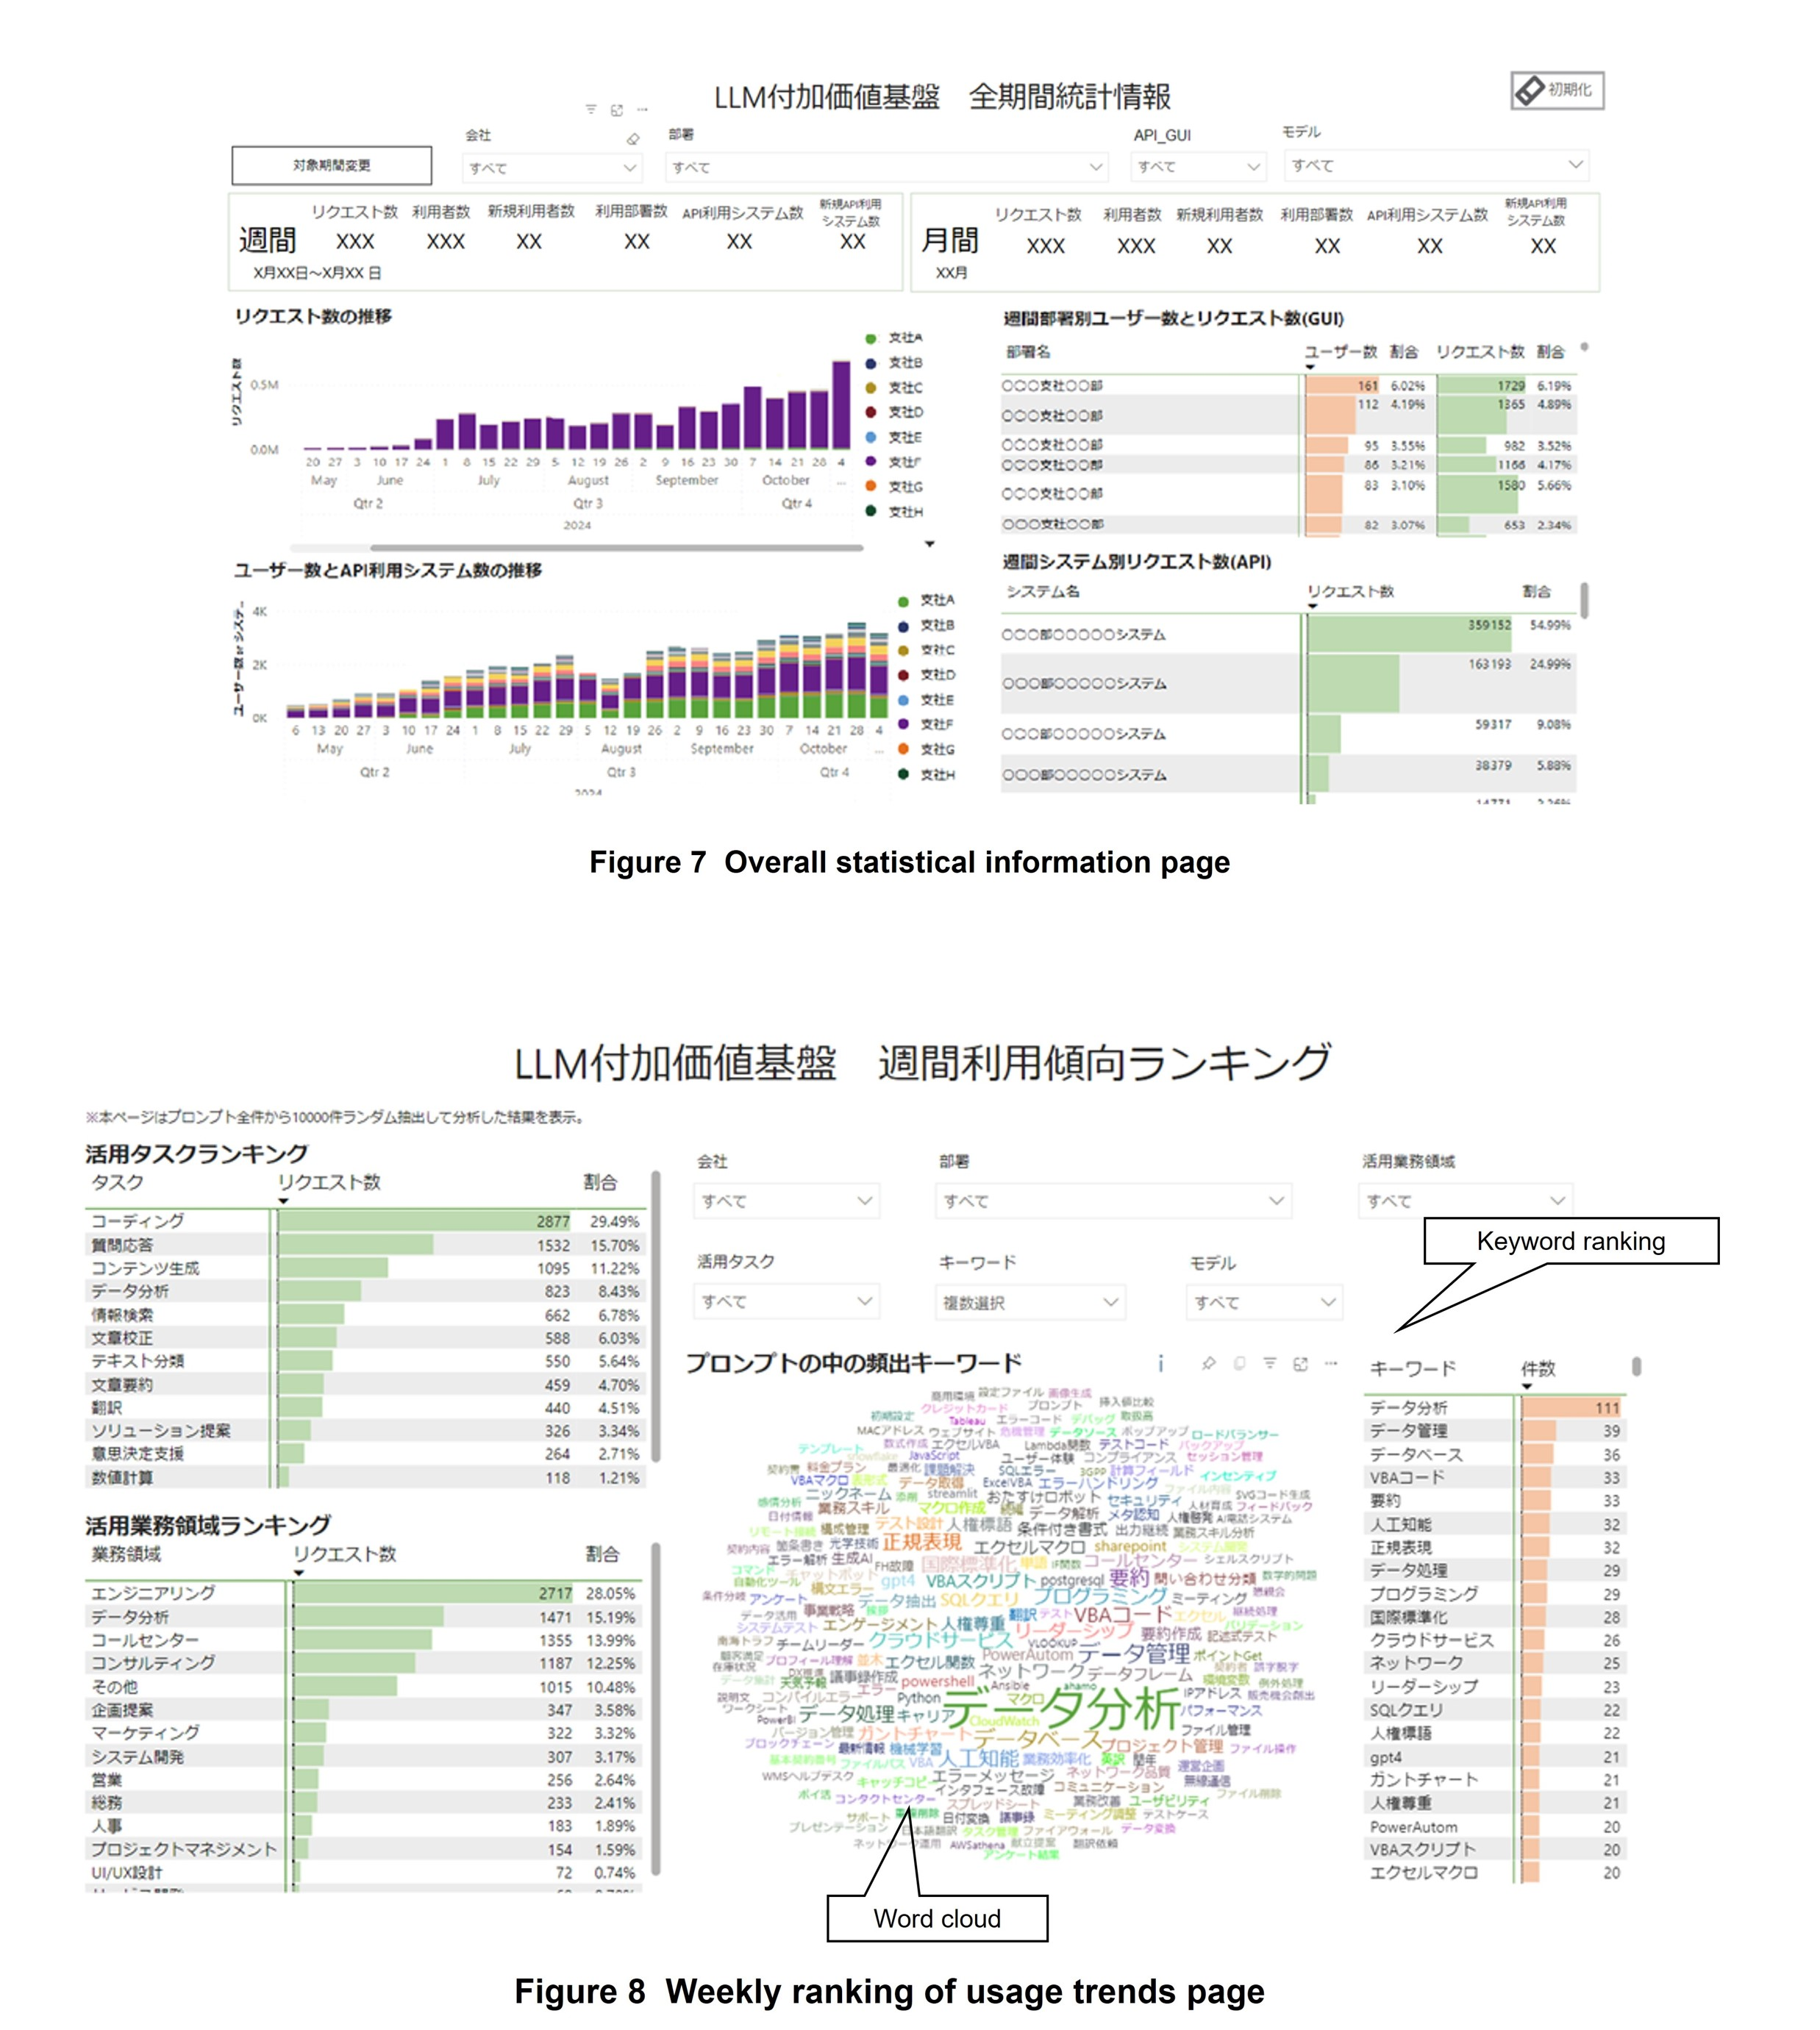
2) Overall Statistical Information Page
This page summarizes statistical information such as the number of users and requests for each company department using the platform (Figure 7). It can be used to implement measures for promoting LLM use, assess the effects of releasing new functions, and quickly prepare usage reports for management and other stakeholders. It is also useful for promoting use of the LLM value-added platform. For instance, understanding which departments have a high number of requests enables interviews to be conducted about effective usage-promotion measures. Additionally, identifying departments with a small number of users enables the implementation of hands-on*15 training on how to use the LLM value-added platform.
The statistical values of each index can be used to check usage for the most recent week and month (Fig. 7 top). In addition, the transition graphs of the number of requests and users can be used to monitor trends over time and compare different periods (Fig. 7 bottom left). Moreover, department/system statistical information can be used to check the number of users and requests for the most recent week for each department and system in a ranking format (Fig. 7 bottom right). The target period for the entire report can be set by selecting “Change target period” and statistical information for specific periods can be viewed (Fig. 7 top).
3) Weekly Ranking of Usage Trends Page
This page summarizes how users use the LLM value-added platform in terms of tasks and business areas (Figure 8). It provides an overview of the main tasks and business areas where the platform is used by each department or LLM. It can also be used to further promote LLM use within one's own business area by reporting the tasks and business areas targeted by LLM users to relevant individuals and organizations such as management. Additionally, it enables users to understand how LLMs are being used by other employees.
The graphs rank user tasks and business areas (Fig. 8 left). This data is based on the results of classifying user prompts by an LLM. This process is designed to classify a prompt given to an LLM into a predefined category such as “coding” or “content creation” if the prompt corresponds to a usage task or “call center” or “consulting” if it corresponds to a business area.
The word cloud*16 and keyword ranking can be used to qualitatively and quantitatively determine frequently appearing keywords extracted from user input prompts (Fig. 8 right). Due to the high cost of analyzing prompts with an LLM, only a portion of prompts extracted randomly from all past prompts is analyzed and displayed on the dashboard.
4) Weekly List of Usage Examples Page
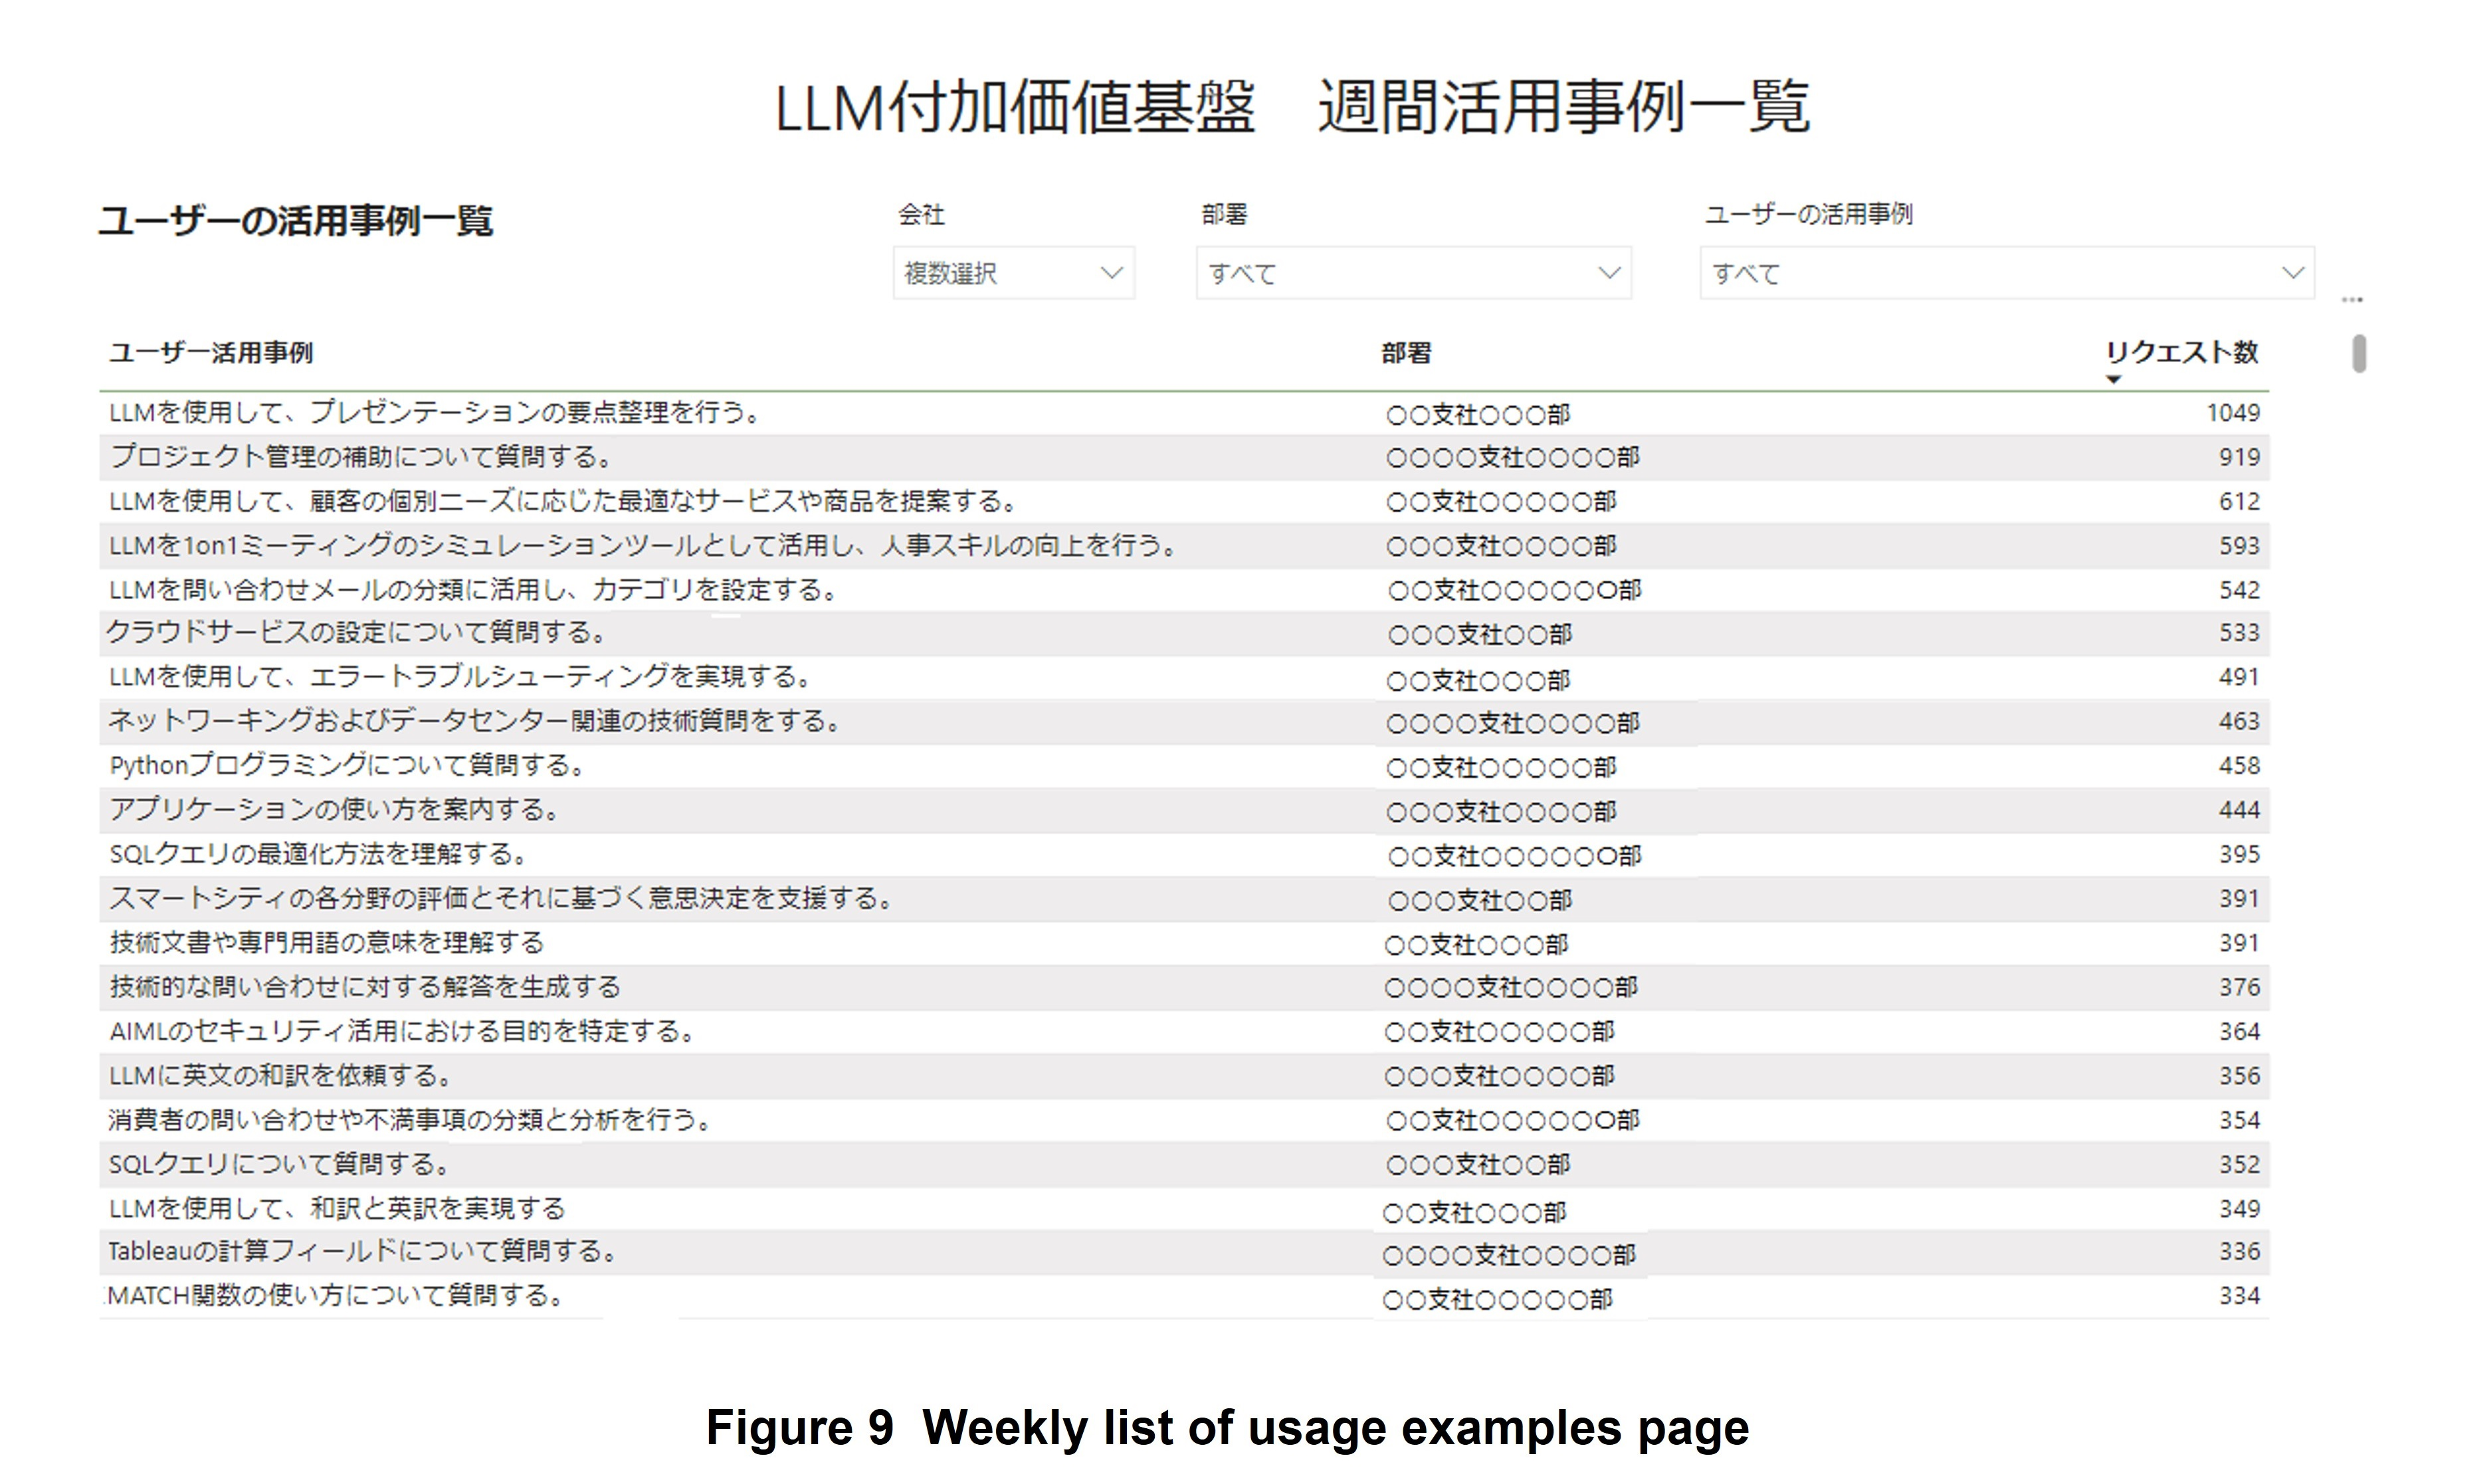
This page visualizes main LLM usage examples and number of requests for each user (Figure 9). With this page, a user can see how other employees are using LLMs and leverage that knowledge to expand the use of LLMs in one's own work.
Similar to the weekly ranking of usage trends page, the weekly list of usage examples page employs an LLM to extract key LLM usage examples from the past prompts of all users and to visually summarize the results. For example, “create a time schedule,” “modify a program,” “create answers to questions,” and “adjust mail writing style” are actual summarized results. Here, summarizing by the LLM uses only the leading text in which instructions are often written instead of inputting the entire text of each prompt. This approach enables summarization processing that is less costly than using the entire text.
5) Weekly User Prompt Details Page
This page allows viewing of the details of user prompts and is accessible to the developers of the LLM value-added platform and dashboard.
The user usage examples analyzed by the weekly list of usage examples page is also displayed on this page. Users can view actual prompts by selecting a usage example of interest.
This page can be used to accumulate useful usage examples that contribute to the promotion of business as collections of prompts, knowledge, etc. Additionally, it can be used to monitor the inclusion of critical confidential information in prompts or information that is prohibited from being input.
- Prompt: The text input into a model to execute a certain task.
- Hands-on: A practical format for learning and training that actually gets one's hands moving.
- Word cloud: A visualization method in which the size of words expresses the frequency of their appearance. The larger the characters, the more frequent the appearance of the word.
-
In this article, we described three technical initiatives in ...
Open
In this article, we described three technical initiatives in support of an LLM value-added platform: 1) improve RAG retrieval accuracy and streamline operations to improve business efficiency and transform business processes, 2) implement and provide UI/UX to enhance convenience and expand use of the platform, and 3) develop a dashboard toward the creation of new use cases and accumulation of LLM usage know-how. On introducing an LLM within a company and rolling out a platform for LLM use, it is important not only to survey and implement advanced technologies but also to perform tests and make improvements on an ongoing basis from diverse viewpoints such as whether the tools are secure, convenient, and useful for users. We will promote the use of our LLM value-added platform by studying a robust architecture design and process flow that can handle a wide range of internal company data and by determining on-site usage trends.
Looking to the future, we aim to uncover highly useful use cases in the following ways: 1) in RAG, we will improve accuracy and make operations more efficient to increase the number of users and improve usage retention rate, 2) in UI/UX, we will continuously collect evaluations and requests from users to improve functions and create and provide dedicated UIs for effective use cases, and 3) for the dashboard, we will add visualization functions to enable advanced forms of analysis and develop algorithms for measuring business improvement effects.
-
REFERENCES
Open
- [1] NTT DOCOMO Press Release: “Verification Trials Begin toward Promotion of Business DX Using Generative AI and Provision of Value-added Services—Development of an LLM Value-added Platform for Improving the Safety and Convenience of Generative AI,” Aug. 2023 (in Japanese).
 https://www.docomo.ne.jp/binary/pdf/info/news_release/topics_230821_00.pdf (PDF format:0)
 - [2] T. Komada et al.: “LLM Platform Technologies for On-site Business Use,” NTT DOCOMO, Vol. 26, No. 1, Apr. 2024.
https://www.docomo.ne.jp/english/corporate/technology/rd/technical_journal/bn/vol26_1/001.html - [3] Databricks: “Data and AI Company.”
 https://www.databricks.com/
 - [4] Microsoft: “Power BI.”
https://www.microsoft.com/en/power-platform/products/power-bi
- [1] NTT DOCOMO Press Release: “Verification Trials Begin toward Promotion of Business DX Using Generative AI and Provision of Value-added Services—Development of an LLM Value-added Platform for Improving the Safety and Convenience of Generative AI,” Aug. 2023 (in Japanese).

