
Special Articles on Evolution of Lifestyle-supporting Estimation Services
Technology for Estimating the Number of Rail Passengers Using Mobile Network Mechanisms for Rail Advertising
Location Information Train Advertisement Train User
Ryo Yamada and Tomohiro Mimura
X-Tech Development Department
Naoto Yoneda
Marketing Innovation Department
Abstract
In the advertising business, the number of people viewing an advertisement (impressions) is measured to visualize the effectiveness of the advertisement. However, for advertisements in railcars, it is necessary to install cameras to measure the number of passengers and collect ticket gate data to calculate impressions, which poses risks from a privacy perspective and costs associated with data collection.
Therefore, NTT DOCOMO developed a technology for estimating the number of railroad users based on base station information. This estimation technology makes it possible to ascertain impressions across railroad companies.
01. Introduction
-
Accurate estimation of the number of travelers by rail has an ...
Open

Accurate estimation of the number of travelers by rail has an important role in the field of urban computing*1 [1]. This entails diverse aims, including support for urban planning, real-time monitoring of traffic, development of smart cities*2, and contribution to user congestion avoidance. Among them, this article introduces estimation of the number of people traveling by rail with the aim of contributing to measuring impressions*3 of rail advertising.
In recent years, digital signage*4 on trains has become more widespread [2]. For those involved in advertising, it is important to know the degree of effectiveness of such advertising signage.
One indicator for measuring advertising effectiveness is impressions. Impressions are quantifications of how many people have seen an advertisement. While it is easy to measure impressions for web advertising, it is difficult to obtain accurate figures of impressions for advertising materials such as billboards and digital signage. In addition, it is difficult to determine the exact number of impressions of rail advertising because the number of railroad users varies depending on various factors, such as music events and sporting events held near rail lines, or the summer vacations of nearby educational institutions. One means of solving this issue is to install cameras and conduct count surveys on an ongoing basis. However, such surveys are impractical due to the large costs involved and the need for comprehensiveness.
Therefore, NTT DOCOMO has focused on the mobile network and developed a technology to estimate the number of passengers traveling between railroad stations from mobile network operational data. This will assist in estimating impressions of advertising materials in railcars from the number of passengers traveling by rail.
This technology has the following three features:
- No cameras are used to ensure privacy.
- It has the ability to estimate station-to-station travelers throughout Japan using mobile network mechanisms.
- Since the technology is not dependent on the train itself, it can accommodate the sharing of trains across railroad companies.
This article describes a station-to-station traveler estimation technology that estimates the number of travelers between station segments.
- Urban computing: Solving issues related to cities by analyzing big data.
- Smart cities: Cities that use big data to improve urban functions.
- Impression: An index indicating the number of times that recommended content has been displayed to users.
- Digital signage: Advertising media using digital technology. Using displays or projectors to change advertising content in response to time or location, this technology is gaining attention as an alternative to conventional advertising media such as posters, etc.
-
2.1 Issues
Open
The station-to-station traveler estimation technology uses the mobile network mechanism to estimate the number of station-to-station travelers in a given station segment on an hourly basis. The number of station-to-station travelers refers to the number of persons who would have boarded one of the railcars in a given station section. Estimation of the number of station-to-station travelers from mobile network operational data is performed by the following procedure.
- Mobile network base stations to which passengers are connected are listed for each railroad line.
- Based on the listed base station information, the number of NTT DOCOMO terminals present in each base station area is totaled in units of station segments.
- Based on the adoption rate of NTT DOCOMO mobile subscriptions per population, the number of station-to-station travelers is extrapolated from the total number of NTT DOCOMO terminals present in each base station area.
However, since the mobile network was not designed to estimate the number of station-to-station travelers in the first place, the number of station-to-station travelers cannot actually be estimated from operational data using the simple procedure described above. Specifically, there are three issues in estimating the number of station-to-station travelers using the mobile network operational data.
1) Difficulty in Determining Which Station Section was Traveled from the Base Station Connection Information
Unlike GPS and other terminal location information, mobile network base station connection information is information about the terminal connected to the base station and does not include the actual location of the terminal. Therefore, there is a difference between location information obtained from the base station connection information and the actual location of the terminal, making it difficult to determine the exact location of the terminal. In particular, at locations where there is a high concentration of base stations, terminals connect to multiple base stations, making it difficult to determine the location of the terminal and consequently difficult to determine which station segment the terminal user has traveled. To solve this issue, a function is needed to link the use of railroads throughout Japan with the corresponding base station connection information.
2) Difficulty in Estimating from Base Station Information Alone Whether a Railroad was Used
Even if the base station connection information in a station segment is obtained, it does not necessarily mean that the terminal user was traveling by rail. In addition, base station connections vary according to various conditions. For example, there are functions to prevent many terminals from concentrating on a single base station during morning congestion, and terminals do not necessarily connect to base stations on the rail line in sequence. As a result, for example, even if the boarding and alighting stations of the Yamanote Line*5 are known, the issue of not knowing whether users rode on the inner or outer loop may arise. In such cases, it is still necessary to estimate which station segment was traveled to estimate the number of station-to-station travelers as accurately as possible.
3) Difference Between the Number of NTT DOCOMO Terminals Connected to NTT DOCOMO Base Stations and the Actual Number of Station-to-station Travelers
Even if the number of terminals in a station segment (the number of terminals present in the coverage area of a base station) can be estimated using the mobile network, this number is limited to NTT DOCOMO terminals, and thus differs from the actual number of station-to-station travelers. Therefore, the number of station-to-station travelers is estimated by simply dividing the number of NTT DOCOMO terminals present in the coverage area by the adoption rate. Specifically, if the NTT DOCOMO terminal line share (adoption rate) is 36% of the Japanese population, the population within a base station coverage area can be estimated by dividing the number of NTT DOCOMO terminals within the area by 0.36 (approximately multiplying by three). However, since the actual adoption rate of NTT DOCOMO terminals varies by region, age, and gender, such a simple division process would result in a large bias by region, age, and gender, which would be inappropriate for estimating the number of station-to-station travelers. These factors need to be taken into account to appropriately extrapolate the population from the number of terminals in the coverage area.
2.2 Estimation
1) Station and Base Station List Creation Function
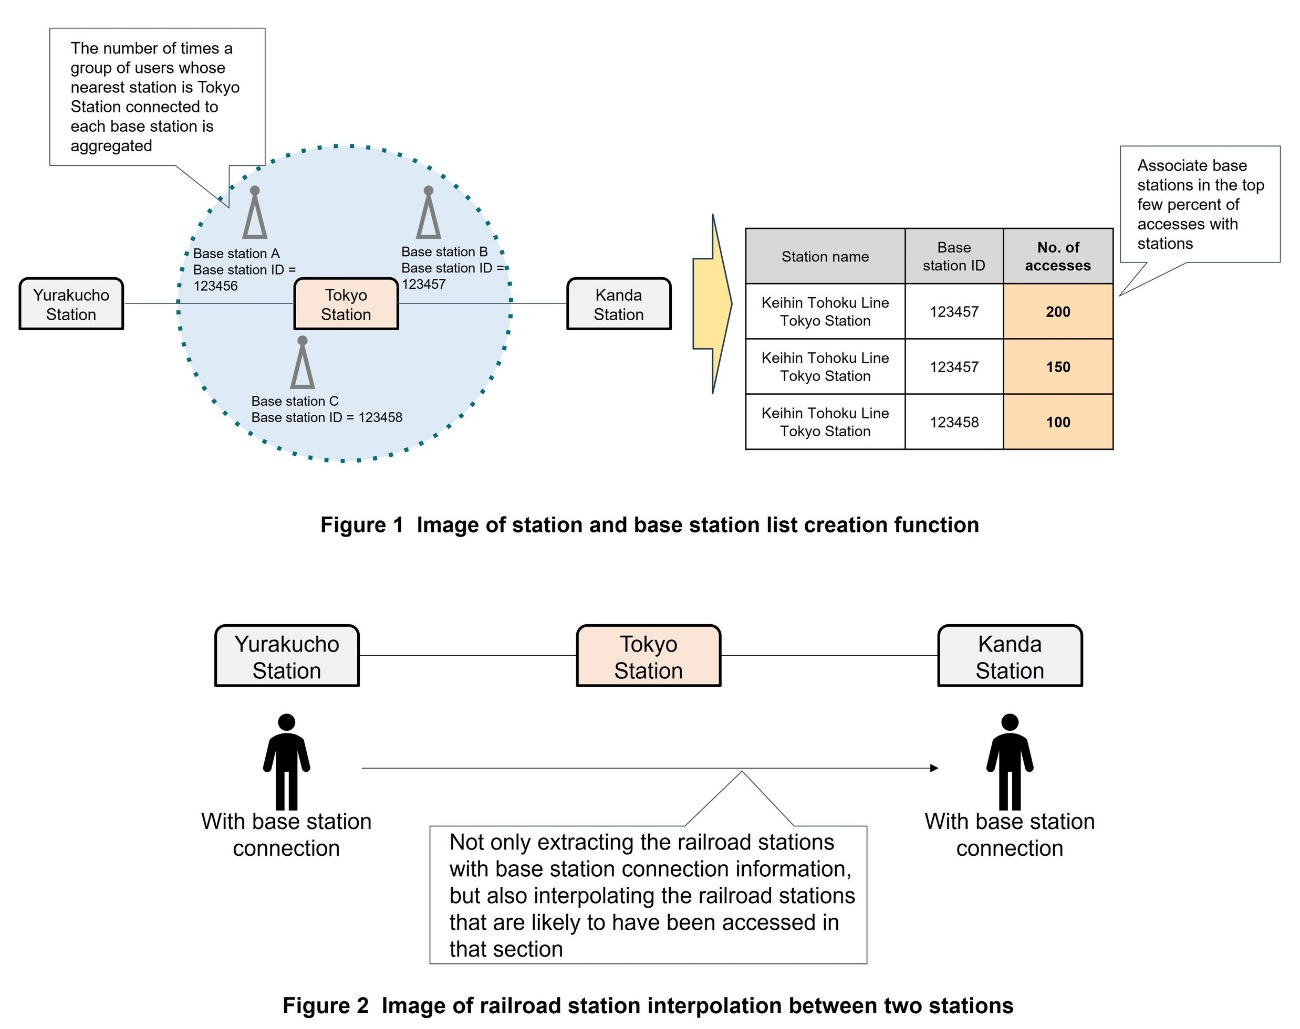
To address the issue of difficulty in determining which station section has been traveled from the base station connection information, a station and base station list is created. The station and base station list creation function links base station connection information with railroad usage. People often use rails to commute to work or school. Therefore, it is assumed that the same terminal user will use the same railroad repeatedly on the same section. This technology uses the above characteristics to associate base stations that a rail user is connected multiple times among those located nationwide with the railroad stations on the basis of the user's rail usage information. Specifically, we extract travel data of assumed rail commuters, create a list of lines and stations used, connecting based stations, and the number of connected terminals, narrows it down to an arbitrary top few percent, and links the railroad stations with connecting base stations to determine which station section the NTT DOCOMO terminal traveled through based on the base station connection information (Figure 1). In this case, the base station connection information used for analysis is limited to data from users who have agreed to “use location information” on the Personal Data Dashboard*6 [3].
2) Station-to-station Travel Conversion Function for Base Station Connection Information
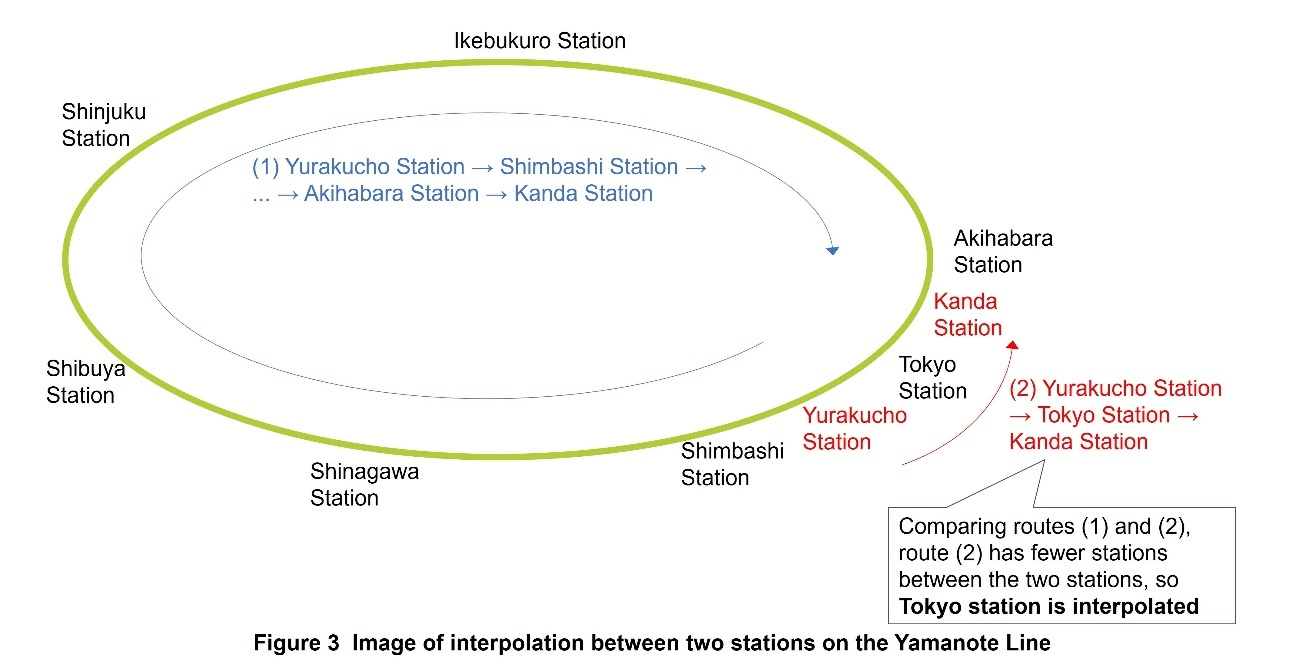
The difficulty in estimating from base station information alone whether a railroad was used is addressed by using the station-to-station travel conversion function for base station connection information. By referring to the list of stations and base stations created and extracting the terminal users who connected to the base stations on each railroad line in the order of these base stations, it is possible to estimate from the base station information alone whether a user used the railroad. However, as mentioned above, terminals do not always connect to base stations on rail lines in sequence. Therefore, the station-to-station travel conversion function for base station connection information interpolates which station section was passed based on the time-series base station connection information and aggregates the number of travelers per station section per time unit. When interpolating, stations between two railroad stations are referenced from rail line and station data. Rail line and station data is information on the location of stations, which rail lines the stations are on, and the connections between stations.
Note that the names of rail lines are sometimes nicknamed by each railroad company, and this may cause some notational errors. For example, West Japan Railway Company has assigned the nickname “Yamato Route” to the electrified section of the Kansai Main Line from Kamo Station in Kizugawa City, Kyoto Prefecture to JR Namba Station in Naniwa Ward, Osaka City, Osaka Prefecture. For this reason, a process was implemented to prevent notational errors if the nickname differs from the route name.
When shaping and processing information on which station segment was traveled based on time-series access station information, the railroad stations between two stations are interpolated using rail line and station data when information on two distant stations is given (Figure 2). However, consideration must be given to circular lines, since it is not possible to determine whether a route is inner or outer loop if information on two stations is given and interpolated mechanically. For example, in the case of the Yamanote Line, when there was access from Yurakucho Station to Kanda Station, it is not possible to judge whether the user moved via “Yurakucho Station → Tokyo Station → Kanda Station” or “Yurakucho Station → Shimbashi Station → ....–.... → Akihabara Station → Kanda Station.” Therefore, interpolation is performed to minimize the number of stations between two stations regardless of the actual movement (Figure 3). By applying this concept, it is possible to interpolate the railroad stations between two stations, and estimate the station section. Thus, the number of rail users is calculated from the base station information alone by extracting terminals that may have used the railroad from the station and base station list and then interpolating movement between stations.
3) Extrapolation
For the difference between the number of terminals connected to NTT DOCOMO base stations and the actual number of station-to-station travelers, the extrapolation process developed in Mobile Spatial Statistics* is used [4]. Specifically, the extrapolation process is performed for each attribute to correctly reflect in the population estimates the adoption rates that vary depending on attributes such as gender, age, and place of residence. This enables the calculation of the number of station-to-station travelers as accurately as possible. In addition, user privacy is guaranteed by appropriately implementing “de-identification” to remove personal identifiability and “disclosure limitation” to remove small numbers of people.
- Yamanote Line: The name of the operating system of rail lines operated by East Japan Railway Company (JR East) that operate in a loop in the Tokyo metropolitan area.
- Personal Data Dashboard: A screen that aggregates information.
- The connection information of cell phone base stations used in this technology is limited to users who have agreed to “use location information” in their Personal Data Dashboard [3]. All results estimated by the analysis are demographic information representing only the number of people in the population and do not identify individual users. In the estimation process, “de-identification” to remove personal identifiers, “extrapolation” to estimate the population by considering NTT DOCOMO's cell phone adoption rate, and “disclosure limitation” to further remove a small number of people are appropriately implemented to maintain user privacy.
-
Figure 4 shows the results of estimating the number of ...
Open
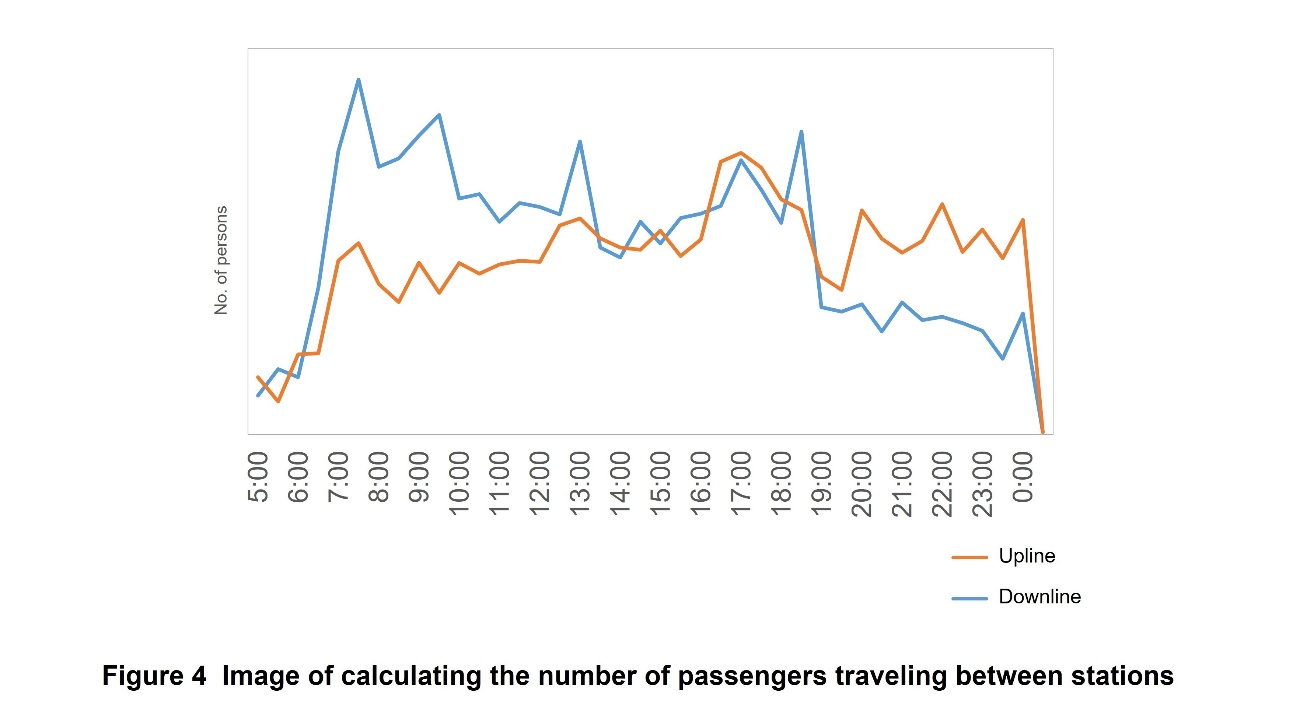
Figure 4 shows the results of estimating the number of passengers traveling between stations on the Tokyo Metro*7 Namboku Line from Tameike-sanno Station to Nagatacho Station, using station-to-station traveler estimation technology. The horizontal and vertical axes in Fig. 4 show the time and number of passengers, respectively, and the broken lines show the average number of passengers traveling between stations on weekdays from Tameike-sanno Station to Nagatacho Station and from Nagatacho Station to Tameike-sanno Station (respectively described as upline and downline). As the figure shows, there is a solid trend in the number of people traveling between stations during the morning and evening commuter rush hours. In particular, the data shows that the direction of congestion is different between the morning and evening rush hours. This data can also be calculated by gender and age group, which is an important aspect in estimating in-rail advertising impressions. Specifically, the effectiveness of the advertisements is measured by accurately calculating the number of passengers of each gender and age group who saw the advertisements.
The calculation results show that it is possible to estimate the number of travelers between railroad stations without using cameras in consideration of privacy. In addition, the Tokyo Metro Namboku Line serves trains from various railroad companies. In this regard, it was found that this technology can estimate the number of travelers between stations regardless of the railroad company. It was also found that the mobile network mechanism can be used to estimate station-to-station travelers throughout Japan without limiting rail lines.
- Tokyo Metro: The nickname of the Tokyo Metro Co., Ltd.
-
This article described a station-to-station traveler estimation ...
Open
This article described a station-to-station traveler estimation technology that estimates the number of travelers between railroad stations. By linking base station connection information with railroad stations, it is possible to estimate the number of station-to-station travelers from the vast base station access logs. In the future, NTT DOCOMO plans to further develop this technology for deployment in a wider range of mobility applications, not limited to railroads. In addition, although the technology is currently being developed with the issue of estimation at station sections, the number of users differs by train formation, for example, when multiple rail lines run parallel to each other. Furthermore, it is assumed that traveler trends will vary by train type, such as express and regular trains. To address this issue, we plan to study technology that will enable estimation at a finer granularity, such as per car, by taking into account user characteristics and the sections where users use railroads.
-
REFERENCES
Open
- [1] J. Zhang, F. Y. Wang, K. Wang, W. H. Lin, X. Xu and C. Chen: “Data-Driven Intelligent Transportation Systems: A Survey,” IEEE Transactions on Intelligent Transportation Systems, Vol. 12, No. 4, pp. 1624–1639, Jul. 2011.
 hhttps://ieeexplore.ieee.org/document/5959985
 - [2] T. Yamamoto: “Trends and Topics in Digital Signage,” The Journal of the Institute of Electrical Installation Engineers of Japan, Vol. 41, pp. 8–12, Jan. 2021 (in Japanese).
https://www.ieiej.or.jp/publish/41.html - [3] NTT DOCOMO: “Understand by Knowing! DOCOMO's Use of Personal Data” (in Japanese).
https://www.nttdocomo.co.jp/utility/personal_data/ - [4] M. Terada et al.: “Population Estimation Technology for Mobile Spatial Statistics,” NTT DOCOMO Technical Journal, Vol. 14, No. 3, pp. 10–15, Jan. 2013.
 https://www.docomo.ne.jp/english/binary/pdf/corporate/technology/rd/technical_journal/bn/vol14_3/vol14_3_010en.pdf (PDF format:716KB)
- [1] J. Zhang, F. Y. Wang, K. Wang, W. H. Lin, X. Xu and C. Chen: “Data-Driven Intelligent Transportation Systems: A Survey,” IEEE Transactions on Intelligent Transportation Systems, Vol. 12, No. 4, pp. 1624–1639, Jul. 2011.

