
Technology for Forecasting the Number of People using a Railway Station, Taking into Account Congestion during Events
Congestion Forecast Location Information Mobile Spatial Statistics
Shuu Ishikawa, Shin Ishiguro and Toru Otaki
X-Tech Development Department
Abstract
The congestion that occurs at railroad stations near venues during major events can be sudden and massive. It is important to know this in advance in order to avoid congestion. Therefore, NTT DOCOMO has developed a technology that can forecast the number of future users of railway stations, taking into account the impact of events and, help railway users avoid congestion. The forecast information using this technology was provided to an accessible route guidance web application developed by NTT and distributed by the All Japan Business Committee during an international sports event held in Tokyo in 2021.
-
In order to travel comfortably, it is important for rail users ...
Open

In order to travel comfortably, it is important for rail users to know in advance how crowded the railways are. This is because, given information in advance, rail users can avoid places and times when congestion occurs (Figure 1). In addition, due to the COVID-19 pandemic, the need for crowd avoidance is even greater, and people are becoming more aware of crowd avoidance [1]. Therefore, technology for predicting railroad congestion has been sought to improve railroad comfort and crowd avoidance. However, railroad usage varies depending on a variety of events. In the past, it has been difficult to accurately predict congestion, especially when large events involving several thousand people or more take place, because rail usage during such events can change dramatically. In light of this situation, NTT DOCOMO has developed a method to meet the need for congestion avoidance by using operation data from mobile phone base stations * to monitor rail congestion in real-time and predict the number of passengers at each station.
NTT DOCOMO has also developed a station congestion forecasting system using this method. To verify its practicality, the forecasting results were made available to the public through the Japan Walk Guide*1[2][3], an accessible route guidance web application developed by Nippon Telegraph and Telephone Corporation (NTT) and distributed by the All Japan Business Committee during an international sports event to be held in Tokyo in 2021. The station congestion forecasting system provided forecast results with an update frequency of once every 10 minutes, enabling the application to display the number of station passengers for each railway station up to 90 minutes in the future in a time series.
In the future, NTT DOCOMO aims to support comfortable travel by developing a service that recommends travel routes that avoid congestion using this system.
This article describes the station congestion forecasting system.
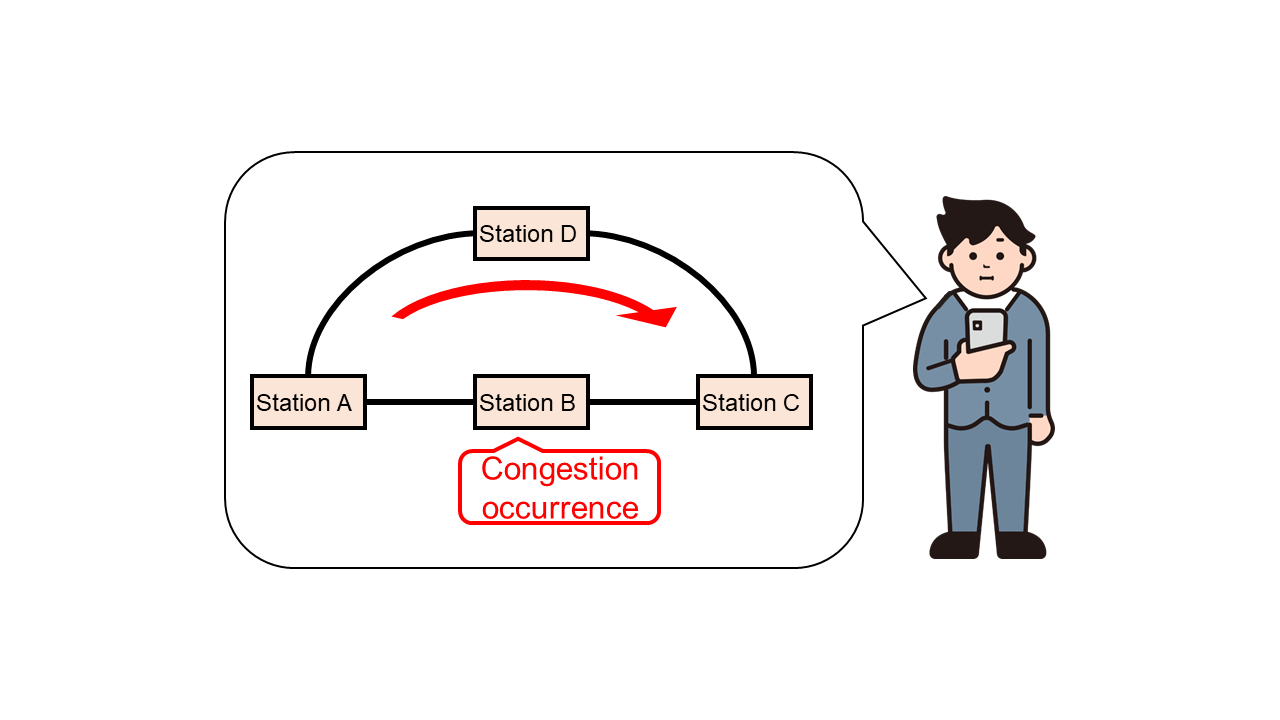
Figure 1 Station congestion prediction system usage image
- The operational data from mobile phone base stations used in this system is limited to customers who have opted in to the “Use of Location Information” feature on the Personal Data Dashboard [5]. All results estimated by the analysis are demographic data that only represent numbers of people in groups and cannot be used to identify individual customers. In the estimation process, de-identification processing to remove personal identifiers, aggregation processing to expand the population estimate by considering NTT DOCOMO’s mobile phone penetration rate, and confidentiality processing to remove small numbers of people are appropriately implemented to protect customer privacy.
- Japan Walk Guide: An accessible route guidance web application developed by NTT in cooperation with the Foundation for Promoting Personal Mobility and Ecological Transportation. This service was provided by the All Japan Business Committee as a service for athletics volunteers and other sports event-related personnel during an international sports event to be held in Tokyo in 2021.
-
2.1 General Overview
Open
The station congestion forecasting system predicts the number of passengers boarding and alighting at a given station up to 90 minutes in the future. In this article, the number of boarding passengers and the number of alighting passengers are collectively defined as the “passenger count,” and congestion is defined as the state in which the passenger count becomes greater than a certain value. Forecasts are limited to 90 minutes into the future because this is the range within which the real-time passenger count forecasting technique described below can be used to improve forecast accuracy.
There are three challenges to forecasting the number of passengers at a station.
- The first is dealing with unusual congestion. For example, rush hour congestion is easy to predict because the time and magnitude of its occurrence varies little. In contrast, congestion that occurs during major events is difficult to predict because the time and magnitude of its occurrence vary specifically depending on the type of event.
- The second is to prepare data on the passenger count at the station. In order to accurately predict future ridership, it is necessary to have a sufficient amount of historical ridership data at all stations to be predicted. Efficient collection of this data is important to achieve highly accurate forecasts.
- The third is real-time performance. Especially during events, the flow of people can change suddenly, causing unforeseen congestion. Therefore, to achieve more accurate forecasts, a mechanism is needed to reflect the most recent congestion in the forecasts.
To solve these problems, the system consists of (1) event-participating population extraction technology, (2) passenger count estimation technology, and (3) real-time passenger count prediction technology.
(1) Event-participating population extraction technology is a population data processing technology that accurately predicts abnormal congestion. By subtracting the normal population from the population on the day of the event, it is possible to extract only the event-related population from the total population in a given area.
(2) The passenger count estimation technology generates passenger count data from NTT DOCOMO’s cellular base station operating data. To estimate the number of passengers at the station to be forecast, the number of passengers traveling from the boarding station to the alighting station is estimated based on the transition of the number of handsets in the area for each base station processed into statistical information.
(3) Real-time passenger count prediction technology is a technology that takes into account the most recent congestion in the vicinity of a station. To predict the future number of passengers, which is a continuous value, a regression model*2 is adopted, which is commonly used to output continuous values. The explanatory variables for this model are the Mobile Spatial Statistics Domestic Population Distribution Statistics (real-time version)*3 formatted by the technology (1). The target variable is the number of passengers estimated using technology (2). Mobile Spatial Statistics Domestic Population Distribution Statistics (real-time version) can sequentially retrieve the most recent population distribution data, enabling more accurate output of future passenger counts while constantly updating forecasts.
2.2 Event-participating Population Extraction Technology
The event-participating population extraction technology is a technology that extracts only the population related to an event (hereinafter referred to as “event-participating population”) from the population distribution data values. The event-participating population is the population calculated for a given area, excluding the population that appears on a daily basis due to commuting to and from work or school, etc. (hereinafter referred to as the “regular population”). Thus, it is the number of event attendees, staff, etc. on the day of an event.
For forecasting in this system, Mobile Spatial Statistics Domestic Population Distribution Statistics (real-time version) was used to take into account the congestion at the event venue and near the station to be forecasted on the day of an event. Mobile Spatial Statistics Domestic Population Distribution Statistics (real-time version) provides population distribution data by grid square*4 [4] (hereinafter referred to as “mesh”). This provides the population of each mesh for a venue.
If this population distribution data were used as is, the sum of the event-participating population and the regular population would be used. In this case, it would be difficult to extract the relationship between the size of the event participants in an event and the sudden crowds that occur as a result of the event, and it would also be difficult to predict unusual and sudden crowds. Therefore, a method is needed to extract the event-participating population from population distribution data.
With Mobile Spatial Statistics Domestic Population Distribution Statistics (real-time version), the event-participating population and the regular population in a general mesh can be obtained as the “event population.” However, in meshes containing facilities where large events are held at a high frequency*5, the number of days that the population changes over time during normal times may be less, making these calculations difficult. The event-participating population extraction technology enables the calculation of the event-participating population and the regular population for such meshes by performing statistical processing using clustering*6 for each mesh of population distribution data.
To obtain a regular population with the event-participating population extraction technology, the following operations were performed (Figure 2). First, the dates that have the same day of the week were enumerated and the population change for 24 hours on each day was obtained. Note that the population change is the change over time of the population that existed within the corresponding mesh. Next, clustering is performed using the population change for each day as data (Fig. 2(1)) to obtain clusters grouped by dates with similar population changes. Then, the cluster with the smallest population average among the obtained clusters is obtained as the regular population (Fig. 2(2)). Using the obtained regular population, the event-participating population is obtained by subtracting the regular population from the population in the original data (Fig. 2(3)).
As a result, it is possible to obtain the event-participating population in the area where an event facility is located, and understand the characteristics of the population changes that occur solely due to the impact of the event. In this way, congestion under unusual circumstances can also be predicted with greater accuracy.
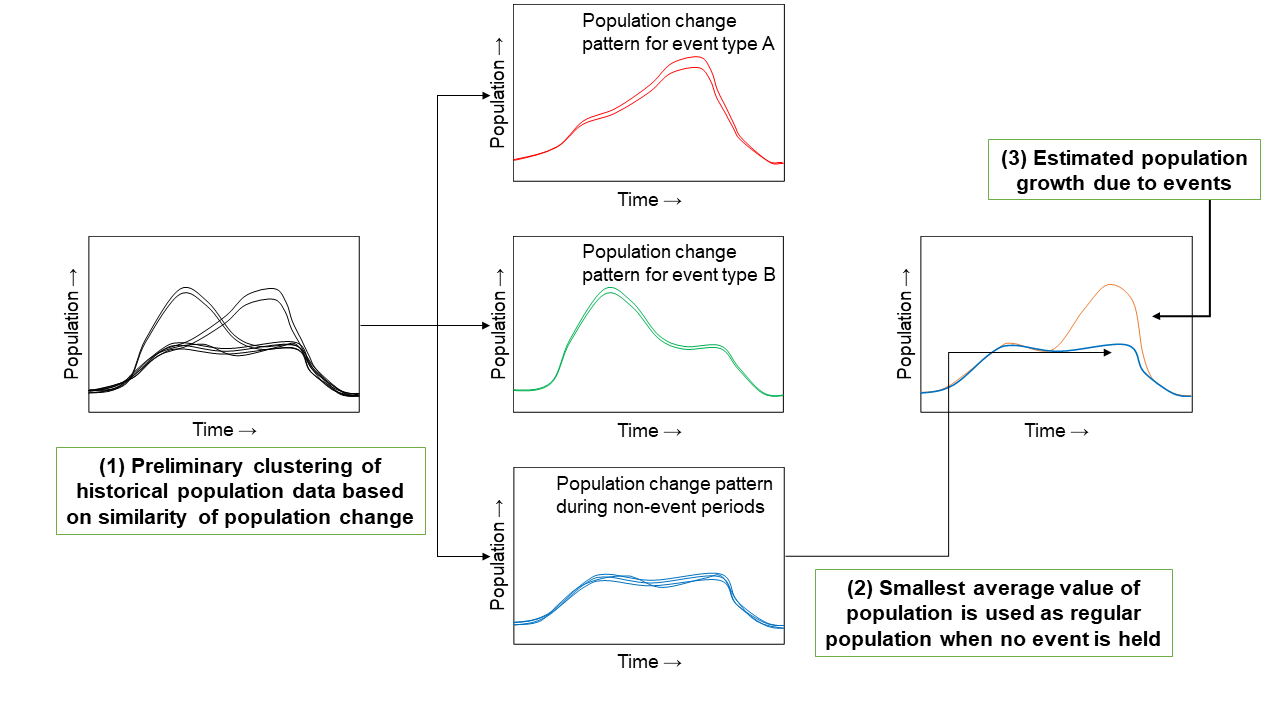
Figure 2 Event-participating population extraction technology procedure for a mesh with a high-frequency event facility
2.3 Passenger Count Estimation Technology
The passenger count estimation technology estimates the number of passengers at a station in the past, which is not available in the Mobile Spatial Statistics Domestic Population Distribution Statistics (real-time version) (Figure 3).
In general, a sufficient amount of historical ridership data is generally required to train a ridership prediction model. Therefore, we used a method to estimate the number of passengers based on operational data from NTT DOCOMO’s mobile base stations. The operational data are limited to those of customers who have agreed to “Use of location information” on the personal data dashboard [5].
Passenger counts were estimated by obtaining the number of mobile terminals on each rail line from this operational data by tabulating information on the presence of user terminal in a cell, and then performing an extended estimation based on the results of the Census [6] to calculate the number of passengers boarding and alighting at any given combination of boarding and alighting stations for a particular line. A three-step process of de-identification, aggregation, and concealment is implemented in this technology to estimate the number of passengers.
By estimating ridership using this mechanism, the training data used in the real-time passenger count prediction technology described below can be updated at a high frequency, allowing training with more recent data, resulting in the creation of models with high predictive accuracy.
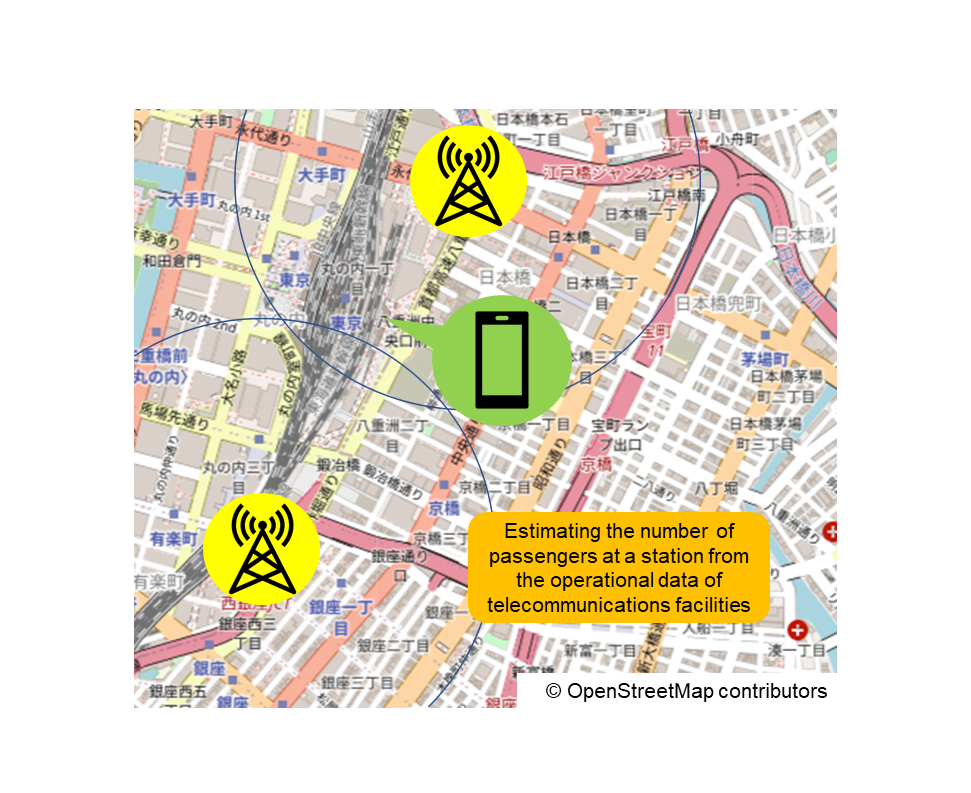
Figure 3 Mechanism of passenger count estimation technology
2.4 Real-Time Passenger Count Prediction Technology
The real-time passenger count prediction technology uses population distribution data obtained from the Mobile Spatial Statistics Domestic Population Distribution Statistics (real-time version) up to one hour in advance to accurately predict future passenger counts (Figure 4). The eXtreme Gradient Boosting (XGBoost)*7 was used for the learning model. The explanatory variables of the model, population distribution data near the event venue and the nearest train station, event schedule data, and weather data, are processed and combined, and the target variable is the number of passengers up to 90 minutes in advance. When training the model, the past passenger count calculated by the passenger count estimation technology is used. At the time of forecasting, by using the most recent population distribution data (at least 1 hour ago) obtained once every 10 minutes, the forecasting results were updated once every 10 minutes. In this way, population distribution data could be obtained at a high frequency, and the accuracy could be improved by updating the forecast values to account for the latest population increase or decrease. The population distribution data used for training and prediction is processed into the event-participating population by the event-participating population extraction technology.
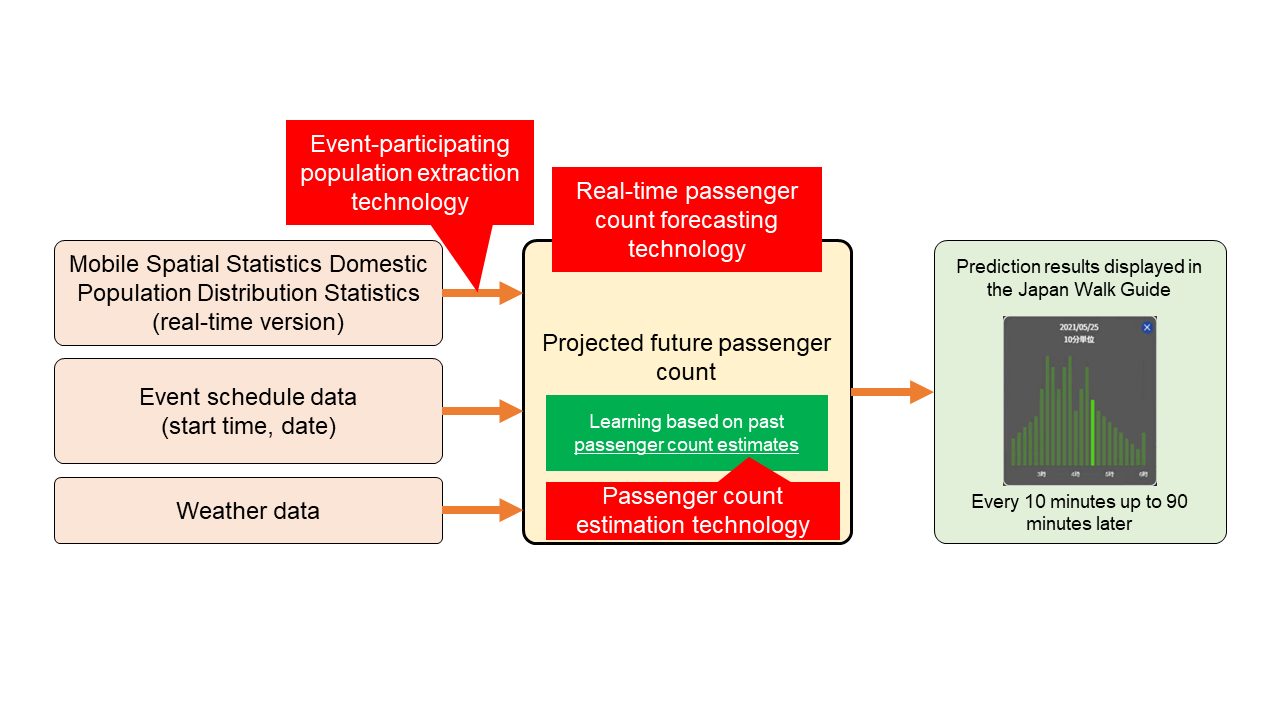
Figure 4 Real-time passenger count prediction technology structure
- Regression model: Modeled as an equation with explanatory variables for an objective variable with continuous values.
- Mobile Spatial Statistics Domestic Population Distribution Statistics (real-time version): One of the Mobile Spatial Statistics, population statistics produced using NTT DOCOMO’s mobile phone network mechanism, providing population distribution data for more than one hour in the past. Mobile Spatial Statistics is demographic information that represents only the number of people in groups, and is generated according to guidelines, and therefore cannot identify individual customers. In addition, the Guidelines for Mobile Spatial Statistics [7] stipulate that “de-identification processing” to remove personal identifiers, “aggregation processing” to expand population estimates by taking into account NTT DOCOMO’s mobile phone penetration rate, and “confidential processing” to remove small numbers of people should be appropriately implemented to protect customers’ privacy.
- Grid square: The land area of a country is divided into a mesh of areas based on latitude and longitude without gaps.
- Facilities where large events are held with high frequency: Facilities whose capacity and the number of events held in a year are above a certain level.
- Clustering: An analytical method that divides a data set into subsets based on similarity between data or distance on an arbitrary scale.
- XGBoost: A machine learning model that achieves highly-accurate regressive prediction by taking a majority vote based on a prediction model using various decision trees.
-
To verify the practicality of this system, the output of this system...
Open
To verify the practicality of this system, the output of this system was connected to the Japan Walk Guide mentioned above. Using this application, users could view the results of the passenger count prediction up to 90 minutes in advance by selecting a station on the map for which they wanted to know the congestion status. The predicted ridership results were displayed in a bar graph (Figure 5).
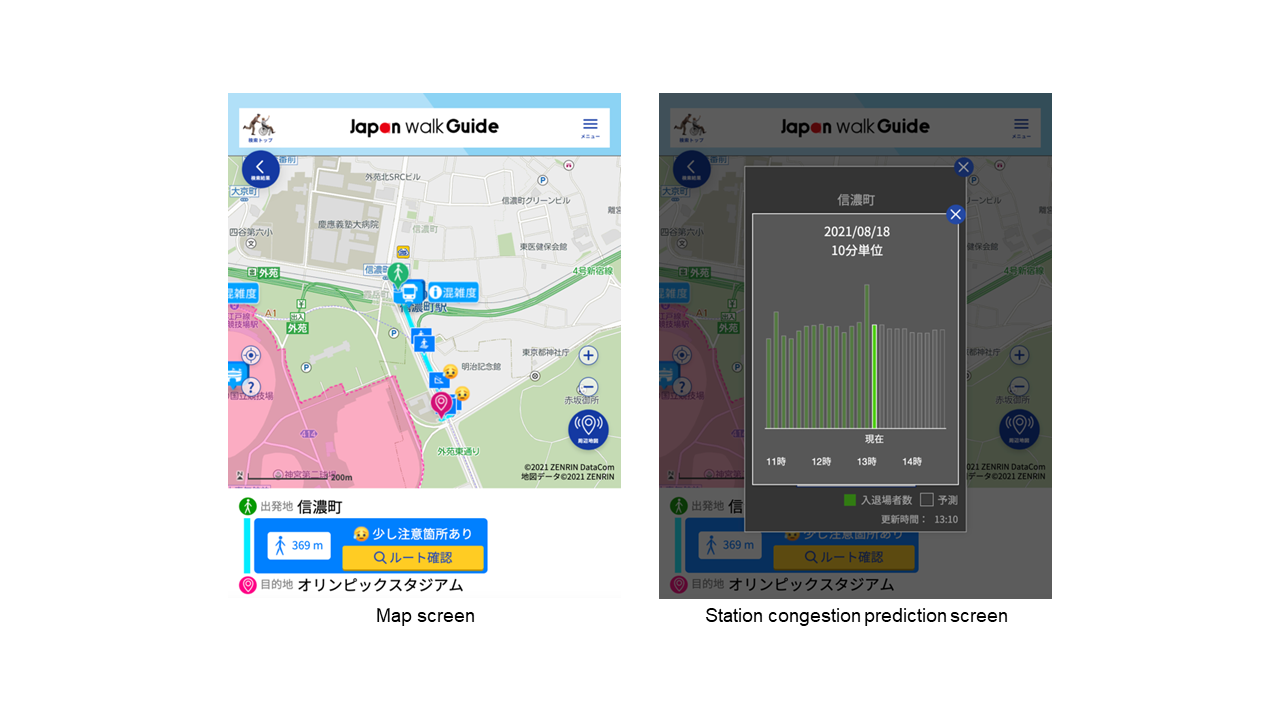
Figure 5 Example of congestion forecast screen in Japan Walk Guide
-
This article has described the details of a station congestion ...
Open
This article has described the details of a station congestion forecasting system that can predict future passenger numbers. We have succeeded in creating a highly practical forecasting model that can handle congestion during events that are considered difficult to predict, generate passenger count data, and reflect the most recent congestion conditions. In the future, verification during a variety of large-scale events will be required. In addition, as an application of this system, we would like to work on developing technology that can forecast congestion outside of railroads, such as bus routes and commercial facilities.
-
REFERENCES
Open
- [1] Urban Railway Policy Division, Railway Bureau, Ministry of Land, Infrastructure, Transport, and Tourism: “Rail User Survey Results,” Jan. 2021 (in Japanese).
 https://www.mlit.go.jp/tetudo/content/001401393.pdf
- [2] NTT DOCOMO Press Release: “Development of ‘Station Congestion Forecasting Technology’ That Can Forecast Post-event Congestion at Locations Where Events Are Held for the First Time,” Aug. 2021 (in Japanese).
https://www.nttdocomo.co.jp/binary/pdf/info/news_release/topics_210819_01.pdf (PDF format:0) - [3] Y. Ichikawa, H. Abe, T. Ito, S. Konagai, S. Fukada and S. Kinoshita: “Barrier–free Route Guidance x MaPiece®,” NTT Technical Review, Vol 20, No.2, pp.60–67, Feb. 2022.
 https://www.stat.go.jp/english/data/mesh/index.html
 - [4] Statistics Bureau of Japan, Ministry of Internal Affairs and Communications: “Grid Square Statistics.”
https://www.stat.go.jp/english/data/mesh/index.html - [5] NTT DOCOMO: “About Personal Data” (in Japanese).
https://www.nttdocomo.co.jp/utility/personal_data/ - [6] Statistics Bureau of Japan, Ministry of Internal Affairs and Communications: “Population Census 2015 Statistical Maps of Japan.”
https://www.stat.go.jp/english/data/chiri/map/c_koku/2015.htm - [7] NTT DOCOMO: “ Mobile Spatial Statistics Guidelines.”
https://www.docomo.ne.jp/english/binary/pdf/service/world/inroaming/inroaming_service/Mobile_Spatial_Statistics_Guidelines.pdf (PDF format:73KB)
- [1] Urban Railway Policy Division, Railway Bureau, Ministry of Land, Infrastructure, Transport, and Tourism: “Rail User Survey Results,” Jan. 2021 (in Japanese).

